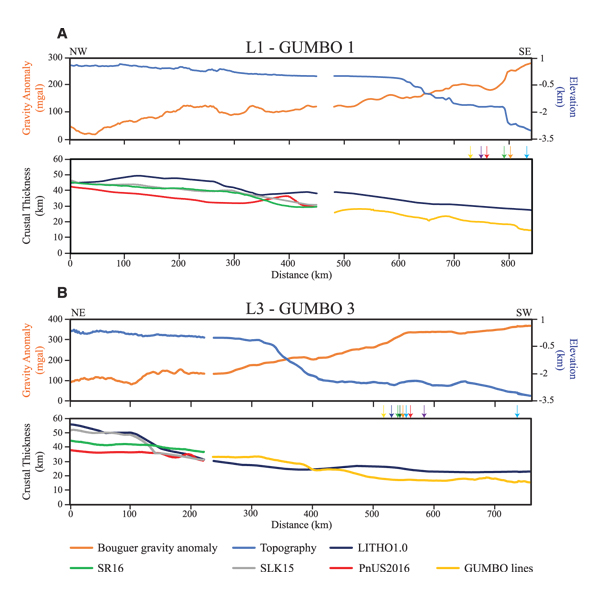
Figure 4.
Cross-sectional profiles of (A) the L1-GUMBO1 line and (B) the L3-GUMBO3 line (profile locations in Fig. 1), displaying lateral variation in Bouguer gravity anomaly, topography, and crustal thickness based on models SR16, SLK15, PnUS2016, and LITHO1.0, along with that from the GUMBO studies. The colored arrows represent the proposed location of the ocean-continent boundary from Marton and Buffler (1994) (yellow); Bird et al. (2005) (purple); Hudec et al. (2013) (light green); Christeson et al. (2014) (red); Pindell and Kennan (2009) (orange); Sandwell et al. (2014) (dark green); Pindell et al. (2014) (dark blue); and Sawyer et al. (1991) (light blue).