
Full Text View
GSA Today
![]()
Article, pp. 4-10 | Abstract | PDF (3MB)
Landslides Triggered by Hurricane Maria: Assessment of an Extreme Event in Puerto Rico
Cover Image
Table of Contents
- Introduction
- Setting
- Hurricane Maria
- Landslide Distribution and Characteristics
- Assessment of Contributing Factors
- Comparison with Past Events
- Conclusions
- Acknowledgments
- References Cited
Search Google Scholar for
- Erin K. Bessette-Kirton
- Corina Cerovski-Darriau
- William H. Schulz
- Jeffrey A. Coe
- Jason W. Kean
- Jonathan W. Godt
- Matthew A. Thomas
- K. Stephen Hughes
Search GSA Today
Abstract
Hurricane Maria hit the island of Puerto Rico on 20 September 2017 and triggered more than 40,000 landslides in at least three-fourths of Puerto Rico’s 78 municipalities. The number of landslides that occurred during this event was two orders of magnitude greater than those reported from previous hurricanes. Landslide source areas were commonly limited to surficial soils but also extended into underlying saprolite and bedrock. Slope failures occurred before, during, and after flooding, and many transitioned into long runout debris flows. Steep slopes in hilly and mountainous regions were particularly impacted by landslides due to antecedent soil moisture levels that were 11%–13% higher than average and rainfall totals of at least 250 mm within a 48 h period. High landslide densities were especially widespread across some geologic formations (e.g., granodiorite of the Utuado batholith); however, bedrock geology alone did not determine the location and distribution of landslides caused by Hurricane Maria. While rainfall data collected during Hurricane Maria were inconsistent, satellite-based soil moisture data were correlated with the distribution of landslides. In the future, the use of soil moisture data could enable assessments of regional landslide susceptibility prior to hurricanes or extreme precipitation events.
Manuscript received 28 Aug. 2018. Revised manuscript received 20 Dec. 2018. Manuscript accepted 5 Jan. 2019. Posted 6 Feb. 2019.
© The Geological Society of America, 2019. CC-BY-NC.
Introduction
Hurricane Maria struck Puerto Rico on 20 September 2017 as the strongest hurricane to make landfall on the island since 1928 (National Weather Service, 2017a). Maria produced heavy rainfall and flooding across most of Puerto Rico and triggered widespread landslides throughout mountainous areas. Landslides damaged and destroyed structures and roads (Puerto Rico Highway and Transportation Authority, 2017, personal commun.; U.S. Geological Survey, 2017a), in some cases isolating communities for days and weeks (e.g., Radebach, 2017; Schmidt and Hernández, 2017). Slope failures caused at least three fatalities (Hennessy-Fiske, 2017; Irizarry Álvarez, 2017), although Kishore et al. (2018) believe that the death toll from Hurricane Maria was underestimated by more than 4000 deaths, some of which could have been related to landslides. Landslides were also partly responsible for damage to the communications and electrical power transmission infrastructure that left much of the island without power for more than six months.
Landslides occur frequently in the mountainous regions of Puerto Rico (e.g., Monroe, 1964, 1979; DeGraff et al., 1989; Larsen and Simon, 1993; Larsen and Torres-Sánchez, 1998; Pando et al., 2005; Lepore et al., 2012). Most noteworthy was the 7 October 1985 Mameyes disaster, which killed at least 129 people and is recognized as the deadliest landslide in North American history (Campbell et al., 1985; Jibson, 1992). Hurricanes and tropical cyclone systems (henceforth referred to collectively as TCs) routinely affect Puerto Rico (Hernández Ayala and Matyas, 2016) and are capable of producing landslide-triggering rainfall (e.g., Campbell et al., 1985; Jibson, 1989; Larsen and Torres-Sánchez, 1992). Landslides have been associated with at least 17 major disaster declarations in Puerto Rico since 1960 (Federal Emergency Management Agency, 2018), and, on average, 1.7 major landslide-triggering storms (TCs and non-TC systems) affect Puerto Rico annually (Pando et al., 2005). The frequency of such events constitutes a hazard to ~1 million U.S. citizens that reside in the predominantly rural interior of the island, much of which is characterized by rugged mountainous terrain (Martinuzzi et al., 2007). Puerto Rico’s vulnerability to extreme rainfall events is sobering given projections of increasingly frequent extreme TCs in the Atlantic Ocean Basin (Knutson et al., 2010).
As a step toward reducing landslide risk during extreme, island-wide precipitation events, we evaluated the extent and characteristics of Maria-induced landslides throughout Puerto Rico. Herein, we present an assessment of island-wide landslide density, which we compare, in conjunction with rainfall data, to TCs that have affected Puerto Rico since 1960. Additionally, we discuss the conditions specific to landsliding in Puerto Rico and examine the impact of environmental variables (e.g., rainfall, soil moisture, and geology) on observed variations in island-wide landsliding. An improved understanding of causative factors specific to landslides in Puerto Rico is important for revised susceptibility analyses and risk management in anticipation of future storms capable of producing widespread landsliding.
Setting
Puerto Rico (18° 15′ N, 66° 30′ W) is the easternmost of the Greater Antilles and covers an area of 8750 km2 (Fig. 1A). Two-thirds of the island is mountainous, with the east-west–trending Cordillera Central range spanning most of the island and reaching a maximum elevation of 1340 m (U.S. Geological Survey, 2017c; Fig. 1A). Broad lowlands and coastal plains ring most of the island. Present-day tectonic uplift resulting from the convergence of the North American and Caribbean plates is one of the main drivers of the rugged topography that is expressed across much of the island (Taggart and Joyce, 1991; Brocard et al., 2015, 2016). The average annual rainfall varies dramatically across micro-climate zones, with the highest annual rainfall usually reported around the Sierra de Luquillo (Fig. 1A) in the northeastern part of the island (Ravalo et al., 1986; Daly et al., 2003). High rainfall, temperature, and humidity contribute to widespread saprolite formation (Murphy et al., 2012).
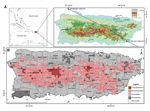 Figure 1
Puerto Rico is part of an extinct volcanic island arc that lies along the North America– Caribbean plate boundary and is underlain by a faulted basement assemblage of Upper Jurassic ocean crustal fragments and Cretaceous to Eocene volcaniclastic and intrusive units (Jolly et al., 1998). This arc complex is unconformably overlain by a cover sequence of Oligocene–Pliocene carbonates and associated siliciclastic deposits (Monroe, 1976; Ortega-Ariza et al., 2015).
Hurricane Maria
Hurricane Maria made landfall along the southeast coast of Puerto Rico as a Category 4 hurricane at 6:15 a.m. local time (Atlantic Standard Time [AST]) on 20 September 2017 (Pasch et al., 2018) and moved across Puerto Rico with a west-northwest trajectory (Fig. 1A). Rainfall data from Hurricane Maria vary both in absolute magnitude and spatial distribution. Estimates of average island-wide rainfall from the National Hurricane Center (NHC; Pasch et al., 2018), the National Centers for Environmental Prediction (NCEP; National Weather Service, 2018), and the PERSIANN-Cloud Classification System (CCS; Center for Hydrometeorology and Remote Sensing, 2018) range from 280 to 543 mm, while maximum rainfall values range from 353 to 1431 mm (see [A] in the GSA Data Repository1 for a summary of rainfall data). Doppler estimates are not available due to the destruction of radar during the storm (National Weather Service, 2017b). Although rainfall estimates from Hurricane Maria vary, multiple data sets indicate that at least 250 mm of rain fell across Puerto Rico’s mountainous terrain, much of which had received 254–381 mm of rainfall from Hurricane Irma two weeks prior to Maria (5–7 September 2017; Cangialosi et al., 2018).
-------
1 GSA Data Repository item 2019079, (A) summaries of published rainfall and soil moisture data from Hurricane Maria and (B) database of past hurricanes and
tropical storms in Puerto Rico with landslide occurrences described when applicable, is available online at www.geosociety.org/datarepository/2019.
Landslide Distribution and Characteristics
To rapidly assess the areas that were most severely impacted by landslides, we used post-hurricane satellite (DigitalGlobe Inc.) and aerial imagery (Sanborn and Quantum Spatial; Vexcel Imaging, 2017) collected between 26 September and 8 October 2017 to map landslide density. A few of the landslides that we mapped may have occurred during Hurricane Irma, but an absence of imagery during the interim precluded us from differentiating between landslides that occurred during each hurricane. We divided the island into a 2 km × 2 km grid and classified each grid cell as either having no landslides (NLS), 1–25 landslides/km2 (low landslide density, LLD) or more than 25 landslides/km2 (high landslide density, HLD). With the intent of rapidly preparing a product to aid emergency response agencies, we visually examined each grid, but did not map individual landslides. Landslide scars were readily visible in imagery because of defoliation from strong winds during Hurricane Maria, and because of the sharp color contrast between exposed soil and rock and the remaining vegetation (Fig. S1 [see footnote 1]). See Bessette-Kirton et al. (2017) for further description of the mapping procedure. We validated and updated our preliminary density map (Bessette-Kirton et al., 2017) by helicopter and on the ground, covering a distance of 1950 km between 26 October and 6 November 2017.
From our mapping, we estimated that more than 40,000 landslides resulted from Hurricane Maria. Landslides occurred in at least 59 of Puerto Rico’s 78 municipalities (Fig. 1B). Many of the other 19 municipalities have such low relief that landsliding is unlikely. Five HLD clusters, ranging in size from 12 to 132 km2, occurred in the north-central and northwestern reaches of the Cordillera Central. Landsliding in the municipalities of Utuado and Naranjito was particularly severe, with ~38% and 45% of each municipality, respectively, classified as having HLD. All five HLD clusters were located ~10–20 km north of the Cordillera Central divide (Fig. 1). Areas along the southern flank of the Cordillera Central, which have some of the highest relief and steepest slopes on the island, generally had lower landslide densities.
During field work, we observed a variety of landslide failure modes and material types and properties. Most landslides were shallow, translational failures in soil or saprolite, generally measuring decimeters to a few meters deep (e.g., Fig. S1A [see footnote 1]). We also observed deeper (up to ~30 m) complex failures (e.g., Fig. S1B) in soil, saprolite, and rock, and rock falls and rock slides. Many landslides transitioned into debris flows (e.g., Figs. S1C and S1D), and coalescence and subsequent channelization of debris flows (e.g., Fig. S1D) was common. Landslides that partly reactivated preexisting landslides were also common. Crosscutting relationships between debris flow and flood deposits indicated that landsliding occurred before, during, and after extreme flooding (e.g., Fig. S1C). Landslides continued to occur during storms in the days and weeks following Maria.
Assessment of Contributing Factors
Our evaluation of landslide distribution shows that while landslides occurred throughout most of Puerto Rico’s mountainous interior, landsliding was particularly severe in five distinct areas (Fig. 1B). We examined rainfall, soil moisture, and geology in NLS, LLD, and HLD areas as a first-order attempt to understand the differences between severely impacted areas and neighboring areas in which landslides were less spatially dense.
Elevated pore-water pressure from rainfall is the most common trigger for landslides (Terzaghi, 1950). Because subsurface-water pressure is not commonly measured, rainfall is often used as a proxy. During Hurricane Maria, rainfall amounts reported by the NHC and NCEP data sets for NLS areas were 7%–12% less than the average island-wide rainfall (Fig. 2). The average island-wide rainfall reported by the PERSIANN-CCS data set was about equal to rainfall in NLS areas (Fig. 2). All three data sets showed that rainfall in LLD and HLD areas was greater than average (4%–19% increase; Fig. 2), but differences in the spatial distribution of rainfall resulted in inconclusive differences between LLD and HLD areas.
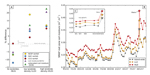 Figure 2
Variability between rainfall data sets calls into question the validity of using island-wide rainfall estimates for localized areas (Fig. S2 [see footnote 1]). Collecting accurate rainfall data during hurricanes is intrinsically difficult due to high winds and the inability to measure sideways rainfall. During Hurricane Maria, these complications were compounded by damage to rain gages (at least 14 of the U.S. Geological Survey’s 24 gaging stations; U.S. Geological Survey, 2017b) and the failure of two Federal Aviation Administration Doppler radars (Buchanan, 2017; National Weather Service, 2017b). Additionally, localized effects, such as orographically enhanced rainfall, may have produced pockets of heavy rain that were not accurately represented by any of the existing data sets.
Soil moisture is a better proxy for pore-water pressure than rainfall because it is a subsurface hydrologic response variable. We found that soil moisture measurements from NASA’s Soil Moisture Active Passive (SMAP) mission (see [A] in the GSA Data Repository [see footnote 1]) differentiated between LLD and HLD areas more effectively than did rainfall data. We compared landslide density to SMAP’s 9 km × 9 km gridded global estimates of root zone (0–100 cm) volumetric water content before (9:30 a.m. AST on 18 September 2017) and after (9:30 p.m. AST on 21 September 2017) Hurricane Maria (Reichle et al., 2018; Fig S3 [see footnote 1]). These estimates rely on remotely sensed measurements of brightness temperatures and the solution of a water and energy balance (see [A] in the GSA Data Repository for details [see footnote 1]). Both antecedent and post-event root zone SMAP measurements showed that soil moisture was 10%–23% greater than the island-wide average in areas where landslides occurred (LLD and HLD areas) and 5%–7% less than the island-wide average in NLS areas (Fig. 2A). Additionally, the difference in deviation from the mean between LLD and HLD areas for antecedent and post-event root zone soil moisture measurements (11%) was nearly twice as large as the spread between LLD and HLD areas for rainfall (3%–6% increase and 7% decrease).
SMAP measurements from the two years prior to Hurricane Maria (Fig. 2B) show that soil moisture across Puerto Rico immediately before Maria (18 September 2017) was 10% above the average island-wide soil moisture during the period of record (April 2015–December 2017). Additionally, the antecedent soil moisture in LLD and HLD areas was 13% and 11% above average, respectively. SMAP data showed that prior to the passage of Hurricane Irma, the average island-wide soil moisture was already higher than normal, and rainfall from Irma only caused a slight increase in island-wide soil moisture (Fig. 2C). The increase in soil moisture caused by heavy rainfall during Hurricane Maria was unprecedented (41%–48% above average) during the time period for which SMAP data are available. However, increased antecedent soil moisture prior to Hurricane Maria evidently influenced the susceptibility to landsliding in LLD and HLD areas. This finding, along with the physical relation between increased pore-water pressure and decreased effective material strength (Terzaghi, 1950), may make soil moisture a useful tool for estimating differential susceptibility to landsliding prior to future storms with predicted heavy and widespread rainfall. Although the resolution of soil moisture data is coarse (9 km × 9 km), and the data for Puerto Rico are primarily derived from a land-surface model without local calibration, our preliminary assessments indicate that SMAP data could be a useful component of landslide forecasting across widespread areas prior to future hurricanes.
An examination of mapped rock formations in mountainous areas indicated that geologic material did not consistently correlate with landslide density. Twelve of the island’s 145 rock formations (Bawiec, 1998) had >10% HLD by area. Landslides were observed nearly everywhere in half of these 12 formations and had HLD classification in ≥11% of their areas. In contrast, the other six formations had HLD in ≥14% of their areas but also had no observed landslides in ≥11% of their areas. Similar variability is also apparent when grouping geologic formations by terrane (Fig. S4 [see footnote 1]). For example, the intrusive igneous rock terrane had the two formations with the highest proportion of HLD area, both of which also had landslides across nearly their entire areas (granodiorite-quartz diorite of the Utuado batholith [Ku] and hornblende quartz diorite porphyry [Thp]; Fig. 3). However, two similar formations both lacked landslides and had large areas of high density landslides (diorite [TKdi] and rhyodacite porphyry [Trhp]; Fig. 3). Finally, the San Lorenzo Formation granodiorite (Ksl) had no HLD areas and lacked landslides in 53% of its area, yet the formation is essentially equivalent to the Ku granodiorite (Bawiec, 1998), which displayed the greatest areal percentage of HLD (63%).
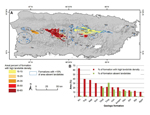 Figure 3
To the extent of the resolution of our data, these variations in landslide density cannot be attributed to differences in rainfall or slope. Instead, it appears that relations between geologic formation and landslide density were largely due to soil moisture variability. For example, Ksl occurs in the eastern quarter of the island where soil moisture was relatively low (0.25–0.26 m3/m3), whereas Ku occurs where soil moisture was relatively high (Fig. S5 [see footnote 1]). Individual formations with large HLD areas (Fig. 3) also reveal trends between landsliding and soil moisture (Fig. S5) when considering formations that cover large areas of Puerto Rico (necessitated by the gross resolution of SMAP data). The three formations that are most widespread from east to west (basaltic breccia and basalt lava [Kln], hornblende quartz diorite porphyry [Thp], and diorite [TKdi]; spanning east-west distances of ~60, 70, and 160 km, respectively) display strong positive correlations between soil moisture and landslide density (Fig. S5). We conclude that landslide densities were not strongly controlled by variable susceptibility to landsliding among the geologic formations, but by variable soil moisture.
Although we have identified spatially averaged correlations between landslide density and soil moisture, the resolution of our island-wide data sets and our method of grid analysis do not allow for differentiation of contributing factors at a scale sufficient for detailed analyses. For example, our analysis of island-wide geology (1:100,000 scale) does not account for localized variations in geologic units that may affect rock weathering rates and soil formation, and therefore landslide susceptibility. The resolution of our 2 km × 2 km grid framework is compatible with island-wide rainfall and soil moisture data sets but is likely less useful for comparison with higher resolution data sets (<4 km2). While our rapidly produced landslide density map allowed for the analysis of contributing factors on a regional scale, a detailed inventory would be invaluable for more localized assessments of landslide susceptibility.
Comparison with Past Events
To place Hurricane Maria in the context of previous landslide-generating TCs, we compiled rainfall data and information on the extent and characteristics of landslides from 72 TCs that affected Puerto Rico between 1960 and 2017 (see [B] in the GSA Data Repository [see footnote 1]). Based on this information, we classified the extent of landsliding as either none, isolated, frequent, or widespread for each TC (Table S2 [see footnote 1]; see Table 1 for classification criteria). In addition to reporting maximum rainfall (Fig. 4A), we calculated the average rainfall in mountainous terrain (mean mountain rainfall [MMR], Fig. 4B) for 56 TCs for which data were available. We used contoured rainfall maps (National Centers for Environmental Prediction, 2018) to extract the average rainfall in areas with slopes >20° for each historical TC to compare with all three rainfall data sets from Hurricane Maria. On average, Hurricane Maria produced more rain than any other TC to affect Puerto Rico in the 58-year record (Fig. 4). Our calculated MMR values for Hurricane Maria range from 287 to 579 mm, and although these values vary by as much as a factor of two, even the minimum is nearly twice as large as the median MMR for all previous widespread landsliding events (152 mm).
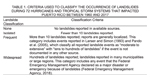 Table 1
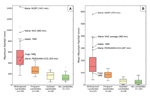 Figure 4
Although TC-triggered widespread landsliding occurs frequently in Puerto Rico, the number and spatial extent of landslides triggered by Hurricane Maria were unprecedented in comparison to previously documented events. For example, Hurricane Hugo (1989) and the precursor to Tropical Storm Isabel (1985) both produced large amounts of rain but only triggered landslides that were confined to localized areas (Jibson, 1989; Larsen and Torres-Sanchez, 1992). Other TC-triggered landslide events have not been documented systematically, and typically refer to “numerous” landslides in one or more municipalities or regions of Puerto Rico (Table S2 [see footnote 1]). Based on our island-wide landslide density map (Fig. 1B), we estimate that the number of landslides triggered by Hurricane Maria (at least 40,000) was approximately two orders of magnitude greater than the hundreds of landslides reported from previous detailed inventories.
Conclusions
Although landsliding is frequent on steep hillslopes in Puerto Rico, the abundance and widespread extent of landslides that occurred during Hurricane Maria were unprecedented in comparison to previously recorded hurricane or tropical storm-triggered landsliding events. Hurricane Maria provided a unique data set to examine the characteristics and contributing factors of landslides with variable failure types and material properties as a means of improving future hazard assessments throughout Puerto Rico.
While we have shown that the average rainfall from Hurricane Maria in mountainous areas was greater than that of any other hurricane or tropical storm in Puerto Rico since 1960, we also found that inconsistencies among rainfall data sets and the coarse resolution of available data did not allow for a meaningful assessment of the correlation between rainfall amount and landslide distribution. Satellite-based SMAP measurements from both before and after Hurricane Maria showed larger differences between low and high landslide density areas, indicating that, unsurprisingly, soil moisture was an important factor in landslide susceptibility. Additionally, above-average antecedent soil moisture levels may have contributed to unprecedented widespread landsliding throughout mountainous areas of Puerto Rico, demonstrating that SMAP data could be used in the future to assess landslide susceptibility prior to hurricanes and tropical storms. We did not observe variable inherent susceptibility to landsliding for geologic bedrock units. Inconsistent correlations between landsliding and underlying bedrock formations likely resulted from differences in soil moisture. While a detailed landslide inventory is necessary for the analysis of localized landslide susceptibility, the rapid quantification of landslide density proved to be advantageous for systematically assessing the impact of widespread landsliding during an extreme precipitation event.
Acknowledgments
We would like to thank Kate Allstadt and two anonymous reviewers for their insightful reviews of our paper. Any use of trade, firm, or product names is for descriptive purposes only and does not imply endorsement by the U.S. Government.
References Cited
- Bawiec, W.J., editor, 1998, Geology, geochemistry, geophysics, mineral occurrences and mineral resource assessment for the Commonwealth of Puerto Rico: U.S. Geological Survey Open-File Report 98-38, https://pubs.usgs.gov/of/1998/of98-038/ (accessed April 2018).
- Bessette-Kirton, E.K., Coe, J.A., Godt, J.W., Kean, J.W., Rengers, F.K., Schulz, W.H., Baum, R.L., Jones, E.S., and Staley, D.M., 2017, Map data showing concentration of landslides caused by Hurricane Maria in Puerto Rico: U.S. Geological Survey data release, https://doi.org/10.5066/F7JD4VRF.
- Brocard, G.Y., Willenbring, J.K., Scatena, F.N., and Johnson, A.H., 2015, Effects of a tectonically-triggered wave on incision on riverine exports and soil mineralogy in the Luquillo Mountains of Puerto Rico: Applied Geochemistry, v. 63, p. 586–598, https:// doi.org/10.1016/j.apgeochem.2015.04.001.
- Brocard, G.Y., Willenbring, J.K., Miller, T.E., and Scatena, F.N., 2016, Relict landscape resistance to dissection by upstream migrating knickpoints: Journal of Geophysical Research, Earth Surface, v. 121, p. 1182–1203, https://doi.org/ 10.1002/2015JF003678.
- Buchanan, S., 2017, Federal collaboration yields radar coverage for Puerto Rico, USVI in wake of Hurricane Maria: DOD lends radars, personnel to assist NOAA with weather forecasts: http://www.noaa.gov/media-release/federal-collaboration-yields-radar-coverage -for-puerto-rico-usvi-in-wake-of-hurricane (accessed April 2018).
- Campbell, R.H., Herd, D.G., and Alonso, R.M., 1985, Preliminary response activities and recommendations of the USGS Landslide Hazard research team to the Puerto Rico landslide disaster of October 7, 1985: U.S. Geological Survey Open-File Report 85-719, 13 p., https://doi.org/10.3133/ofr85719.
- Cangialosi, J.P., Latto, A.S., and Berg, R., 2018, National Hurricane Tropical Cyclone Report, Hurricane Irma (AL112017), 30 August–12 September 2017: National Hurricane Center, https://www.nhc.noaa.gov/data/tcr/AL112017_Irma.pdf (accessed April 2018).
- Center for Hydrometeorology and Remote Sensing, 2018, Data Portal: http://chrsdata .eng.uci.edu (accessed April 2018).
- Daly, C., Helmer, E.H., and Quiñones, M., 2003, Mapping the climate of Puerto Rico, Vieques and Culebra: International Journal of Climatology, v. 23, no. 11, p. 1359–1381, https://doi.org/10.1002/joc.937.
- DeGraff, J.V., Bryce, R., Jibson, R.W., Mora, S., and Rogers, C.T., 1989, Landslides: Their extent and significance in the Caribbean, in Brabb, E., and Harrod, B.L., eds., Landslides: Extent and Economic Significance: Proceedings 28th International Geological Congress Symposium on Landslides: Washington, D.C., Rotterdam and Brookfield, p. 51–80.
- Federal Emergency Management Agency, 2018, Disasters: https://www.fema.gov/disasters (accessed April 2018).
- Hennessy-Fiske, M., 2017, In one Puerto Rico mountain town, a wall of mud came crashing down: http://www.latimes.com/nation/la-na-puerto-rico-landslide-20170924 -story.html (accessed April 2018).
- Hernández Ayala, J.J., and Matyas, C.J., 2016, Tropical cyclone rainfall over Puerto Rico and its relations to environmental and storm-specific factors: International Journal of Climatology, v. 36, p. 2223–2237, https://doi.org/10.1002/joc.4490.
- Irizarry Álvarez, F., 2017, Mueren tres hermanas por derrumbe en Utuado tras paso de María: http://www.primerahora.com/noticias/puerto-rico/nota/muerentres hermanasporderrumbeenutuadotraspaso demaria-1246727/ (accessed July 2018).
- Jibson, R.W., 1989, Debris flows in southern Puerto Rico, in Schultz, A.P. and Jibson, R.W., eds., Landslide Processes of the Eastern United States and Puerto Rico: Geological Society of America Special Paper 236, p. 29–56, https://doi.org/ 10.1130/SPE236-p29.
- Jibson, R.W., 1992, The Mameyes, Puerto Rico, landslide disaster of October 7, 1985, in Slosson, J.E., Keene, A.G., and Johnson, J.A., eds., Landslides/Landslide Mitigation: GSA Reviews in Engineering Geology, v. IX, p. 37–54, https://doi.org/10.1130/REG9-p37.
- Jolly, W.T., Lidiak, E.G., Dickin, A.P., and Wu, Tsai-Way, 1998, Geochemical diversity of Mesozoic island arc tectonic blocks in eastern Puerto Rico, in Likiak, E.G., and Larue, D.K., eds., Tectonics and Geochemistry of the Northeastern Caribbean: Geological Society of America Special Paper 322, p. 67–98, https://doi.org/10.1130/0-8137-2322-1.67.
- Kishore, N., and 14 others, 2018, Mortality in Puerto Rico after Hurricane Maria: The New England Journal of Medicine, Special Article, https://doi.org/10.1056/NEJMsa1803972.
- Knutson, T.R., McBride, J.L., Chan, J., Emanuel, K., Holland, G., Landsea, C., Held, I., Kossin, J.P., Srivastava, A.K., and Sugi, M., 2010, Tropical cyclones and climate change: Nature Geoscience, v. 3, p. 157–163, https://doi.org/ 10.1038/ngeo779.
- Larsen, M.C., and Simon, A., 1993, A rainfall intensity-duration threshold for landslides in a humid-tropical environment, Puerto Rico: Geografiska Annaler. Series A. Physical Geography, v. 75, no. 1–2, p. 13–23, https:// doi.org/10.1080/04353676.1993.11880379.
- Larsen, M.C., and Torres-Sánchez, A.J., 1992, Landslides triggered by Hurricane Hugo in eastern Puerto Rico, September 1989: Caribbean Journal of Science, v. 28, no. 3–4, p. 113–125.
- Larsen, M.C., and Torres-Sánchez, A.J., 1998, The frequency and distribution of recent landslides in three montane tropical regions of Puerto Rico: Geomorphology, v. 24, no. 4, p. 309–331, https://doi.org/10.1016/ S0169-555X(98)00023-3.
- Lepore, C., Kamal, S.A., Shanahan, P., and Bras, R.L., 2012, Rainfall-induced landslide susceptibility zonation of Puerto Rico: Environmental Earth Sciences, v. 66, no. 6, p. 1667–1681, https://doi.org/10.1007/s12665-011-0976-1.
- Martinuzzi, S., Gould, W.A., and Ramos González, O.M., 2007, Land development, land use, and urban sprawl in Puerto Rico integrating remote sensing and population census data: Landscape and Urban Planning, v. 79, p. 288–297, https://doi.org/10.1016/ j.landurbplan.2006.02.014.
- Monroe, W.H., 1964, Large retrogressive landslides in north-central Puerto Rico, in Geological Survey Research 1964, Chapter B: Washington, D.C., United States Government Printing Office, 191 p.
- Monroe, W.H., 1976, The karst landforms of Puerto Rico: U.S. Geological Survey Professional Paper 899, 69 p.
- Monroe, W.H., 1979, Map showing landslides and areas of susceptibility to landsliding in Puerto Rico: U.S. Geological Survey Miscellaneous Investigations Series Map I-1148, scale 1:240,000, 1 sheet.
- Murphy, S.F., Stallard, R.F., Larsen, M.C., and Gould, W.A., 2012, Physiography, geology, and land cover of four watersheds in eastern Puerto Rico: U.S. Geological Survey Professional Paper 1789-A, 24 p.
- National Centers for Environmental Prediction, 2018, Tropical Cyclone Rainfall Data: https://www.wpc.ncep.noaa.gov/tropical/rain/tcrainfall.html (accessed April 2018).
- National Weather Service, 2017a, Major Hurricane Maria—September 20, 2017: https://www.weather.gov/sju/maria2017 (accessed April 2018).
- National Weather Service, 2017b, Public Information Statement: https://www.weather .gov/media/serfc/PNSQPESJU2.pdf (accessed April 2018).
- National Weather Service, 2018, Advanced Hydrologic Prediction Service, QPE: Quantitative Precipitation Estimates: https://water.weather.gov/precip/ (accessed April 2018).
- Ortega-Ariza, D., Franseen, E.K., Santos-Mercado, H., Ramirez-Martinez, W.R., and Core-Suarez, E.E., 2015, Strontium isotope stratigraphy for Oligocene–Miocene carbonate systems in Puerto Rico and the Dominican Republic: Implications for Caribbean processes affecting depositional history: The Journal of Geology, v. 123, no. 6, p. 539–560, https://doi.org/10.1086/683335.
- Pando, M.A., Ruiz, M.E., and Larsen, M.C., 2005, Rainfall-induced landslides in Puerto Rico: An overview, in Proceedings GeoFrontiers Congress 2005: Austin, Texas, USA, p. 2911–2925, https://doi.org/ 10.1061/=40787(166)25.
- Pasch, R.J., Penny, A.B., and Berg, R., 2018, National Hurricane Center Tropical Cyclone Report, Hurricane Maria (AL152017), 16–30 September 2017: https://www.nhc.noaa.gov/data/tcr/AL152017_Maria.pdf (accessed April 2018).
- Puerto Rico Highway and Transportation Authority, 2017, Hurricane Maria Events: Puerto Rico Department of Transportation GIS Office, personal communication (November 2017).
- Radebach, M., 2017, From cut-off to connected: HHS and the U.S. Army work together to protect health in Utuado, Puerto Rico following a landslide: https://www.phe.gov/ASPRBlog/Lists/Posts/Post.aspx?List=f59454e5-a08d -4a13-9abe-0d31ef99f1af&ID=283&Web =e1195e40-c916-4c28-aa5a-de2eda4302e4 (accessed April 2018).
- Ravalo, E.J., Goyal, M.R., and Almodóvar, C.R., 1986, Average monthly and annual rainfall distribution in Puerto Rico: The Journal of Agriculture of the University of Puerto Rico, v. 70, no. 4, p. 267–275.
- Reichle, R., De Lannoy, G., Koster, R.D., Crow, W.T., Kimball, J.S., and Liu, Q., 2018, SMAP L4 Global 3-hourly 9 km EASE-Grid Surface and Root Zone Soil Moisture Analysis Update, Version 4: NASA National Snow and Ice Data Center Distributed Active Archive Center, https://doi.org/10.5067/60HB8VIP2T8W (accessed July 2018).
- Schmidt, S., and Hernández, A.R., 2017, Trapped in the mountains, Puerto Ricans don’t see help, or a way out: https://www.washingtonpost.com/national/trapped-in-the-mountains-puerto-ricans-dont-see-help-or-a-way-out/2017/ 10/01/7621867e-a647-11e7-ade1-76d061d56efa_story.html?utm_term=.81c3d4ba1b29 (accessed April 2018).
- Taggart, B.E., and Joyce, J., 1991, Radiometrically dated marine terraces on northwestern Puerto Rico, in Larue, D.K., and Draper, G., eds., Transactions of the 12th Caribbean Geological Conference: St. Croix, U.S.V.I., Coral Gables, Miami Geological Society, p. 248–258.
- Terzaghi, K., 1950, Mechanism of landslides, in Paige, S., ed., Application of Geology to Engineering Practice (Berkey Volume): New York, Geological Society of America, p. 83–124.
- U.S. Geological Survey, 2017a, Preliminary Locations of Landslide Impacts from Hurricane Maria, Puerto Rico: https://www .usgs.gov/natural-hazards/landslide-hazards/science/preliminary-locations-landslide-impacts-hurricane-maria?qt-science_ center_objects=0#qt-science_center_objects (accessed April 2018).
- U.S. Geological Survey, 2017b, Hurricane Maria’s Water Footprint: https://owi.usgs.gov/vizlab/hurricane-maria/ (accessed April 2018).
- U.S. Geological Survey, 2017c, 3DEP: https://viewer.nationalmap.gov/basic/ ?basemap=b1&category=ned,nedsrc&title =3DEP%20View (accessed July 2018).
- Vexcel Imaging, 2017, Puerto Rico post Maria—Dynamic Image Service: http://www.arcgis .com/home/item.html?id=b1949283c1084b0daf2987d896392ac2 (accessed April 2018).