
Full Text View
Volume 28 Issue 1 (January 2018)
GSA Today
![]()
Article, pp. 4-10 | Abstract | PDF (334KB)
Jurassic Sea-Level Variations: A Reappraisal
Cover Image
Table of Contents
- Introduction
- Jurassic Time Scale
- Revision of the Jurassic Sea-Level Curve
- Results
- Discussion and Conclusions
- Acknowledgments
- References Cited
Search GoogleScholar for
Search GSA Today
Abstract
An accurate chronostratigraphy of the timing and magnitude of global sea-level trends and their short-term variations is an indispensable tool in high-resolution correlations, exploration, and paleoenvironmental and geodynamic models. This paper is a reappraisal of the Jurassic sea-level history in view of recent updates in time scales and a large body of new chronostratigraphic data accrued since 1998, when the last such synthesis was presented. A review of the Jurassic sea-level history has also been keenly awaited by explorationists given that the Jurassic continues to be a major exploration target for the industry. As in previous eustatic models of this period, the updated Jurassic sea-level curve remains largely Eurocentric due to the limitations imposed by biostratigraphic correlation criteria (provinciality of ammonite and microfossil zones), though it can now be extended to some parts of the Tethys toward the east. The updated long-term curve indicates that there was a general rise of sea level through the Jurassic that began close to a level similar to or below the present-day mean sea level (pdmsl) in the early Jurassic, culminating in the peak high in the late Kimmeridgian–early Tithonian interval, before stabilizing in the earliest Cretaceous at ~110 m above pdmsl. Within this long-term trend are relative second-order highs in the Toarcian and Aalenian, and at Bathonian-Callovian and Kimmeridgian-Oxfordian boundaries. Superimposed are 64 third- and fourth-order fluctuations of which 15 are considered major with base-level falls of more than 75 m, although precise amplitudes of drawdowns are often difficult to establish. Higher resolution fourth-order cyclicity (~410 k.y.) is also observable in many Jurassic sections whenever sedimentation rates were high. Causes for the third-order cyclicity, in the absence of major ice sheets in the Jurassic, remains enigmatic.
Manuscript received 5 Sept. 2017. Revised manuscript received 26 Sept. 2017. Manuscript accepted 26 Sept. 2017. Posted online 24 Oct. 2017.
© The Geological Society of America, 2017. CC-BY-NC.
Introduction
A record of sea-level variations of the past inferred from the stratigraphy of continental margins and interior basins (where the movements of the shoreline can be best documented) is a key predictive tool in hydrocarbon exploration. These data can provide insights into several pre-drill assessment criteria, including the migration of reservoir facies in response to rises and falls of sea level, the frequency and duration of subaerial exposure during lowstands, and the generation and preservation of source rocks during transgressions and highstands. The broad trends in Jurassic sea-level variations have been known for some time (Vail et al., 1977; Hallam, 1978, 2001; Haq et al., 1987, 1988; Hardenbol et al., 1998; Haq and Al-Qahtani, 2005), but recent updates of time scales and the accrual of new stratigraphic data from the period dictate a reappraisal of Jurassic eustatic history, especially at the third-order (shorter-term) time scales. A reappraisal of the long- and short-term trends of the base level would also be useful for academic research because such information can be the basis of stratigraphic, paleoenvironmental, and geodynamic models. In this communication, a brief summary of the updated version of the Jurassic sea-level history is presented so that it can be expediently made available to the research community.
The Jurassic period is currently estimated to have lasted some 55.6 m.y. (201.3–145.7 Ma) (Ogg et al., 2016). The period saw relatively low sea levels in the Early Jurassic, with the exception of the early Toarcian, which witnessed a relative high, a variable overall lowstand in the Middle Jurassic, and a gradual rise thereafter that lasted through much of the Late Jurassic. Climates also paralleled these trends. Faunal and isotopic data imply relatively warm climates for most of the Jurassic, with some exceptions, lacking credible evidence for widespread glaciations in much of this period. However, the relative warmth of the Hettangian through Toarcian interval seems to have been interrupted by a cooler late Pliensbachian through early Toarcian (Hinnov and Park, 1999; Dera et al., 2009; Suan et al., 2010; Korte and Hesselbo, 2011; Korte et al., 2015). Korte and Hesselbo (2011) believe that the Early Jurassic may have fluctuated between greenhouse and icehouse conditions. There may also have been some cooler intervals in the Aalenian, Bajocian, Bathonian, and early Callovian (Rogov and Zakharov, 2010), as well as a cold spell near the Middle–Late Jurassic transition (in the late Callovian) (Dromart et al., 2003). Most of the Late Jurassic is interpreted to have been relatively warmer and equable, experiencing peak warmth in the Kimmeridgian (Frakes et al., 1992; Zakharov et al., 2006; Brigaud et al., 2008). Although actual global temperatures and atmospheric or oceanic latitudinal thermal gradients of the Jurassic are only conjectured, modeling indicates that pCO2 levels may have been a minimum of four times the present-day levels (see, e.g., Sellwood and Valdes, 2008). The long-term sea level and climatic trends also show an apparent correspondence.
Jurassic Time Scale
Jurassic time scales have been in a significant state of flux since the last third-order sea-level curve for this period was published by Haq et al. (1988) or the later update by Hardenbol et al. (1998). Considerable advancements have been made to better delimit the stage boundaries of the Jurassic, and the most recent effort to update this time scale was presented by Ogg and Hinnov (2012) and Ogg et al. (2016). The last version of the Jurassic time scale is partially based on constraints from best fits of numerical radiometric ages, partially on cyclostratigraphy in strata of various stages and oxygen and other isotopic data. Magnetostratigraphy was helpful only in the Bajocian through Tithonian interval (with a hiatus at Callovian-Oxfordian transition) where the low-amplitude seafloor magnetic anomalies (from Ocean Drilling Program site 801 on the older part of eastern Pacific Plate) could be tied to magnetostratigraphy. The attempts to astronomically fine-tune discrete intervals of the Jurassic (see, e.g., Strasser, 2007, and a summary by Huang in Ogg and Hinnov, 2012) may help with duration of some zonal intervals, but such piecemeal efforts do not alleviate the precision issues of all of the stage boundaries that are exacerbated by the lack of reproducible radiometric control for much of the Middle and Late Jurassic. This implies that, in general, the time scale of the Jurassic and precision of the ages of many biostratigraphic zonal boundaries still remain less than well constrained. As Ogg and Hinnov (2012) state, the Jurassic scale “should be considered a work in progress” and although new constraints have refined the overall numerical chronology, “several intervals lack adequate constraints.” Any future modifications of the time scale will obviously necessitate the recalibration of the sea-level chronology.
Revision of the Jurassic Sea-Level Curve
The main correlative tool in the Jurassic marine strata is ammonite biostratigraphy, occasionally assisted by other fossil groups, such as dinoflagellates, radiolaria, calcareous nannofossils, and calpionellids (the last only in the Late Jurassic). In the earlier Meso-Cenozoic sequence chronostratigraphy of third-order sea-level changes (Haq et al., 1988, and later by Hardenbol et al., 1998), the Jurassic sequence chronostratigraphy was based on sections in northern and central Europe (northern and southern coasts of England, west-central France, southern Germany, and Switzerland) and their ammonite and microfossil content (mostly dinoflagellates, foraminifera, nannoplankton, and calpionellids). In that Meso-Cenozoic synthesis (Haq et al., 1988; Hardenbol et al., 1998), a special attempt was made to study all available stage stratotype (or neo-stratotype) sections (including those from the Jurassic) that form the basis (or a global standard) for biochronostratigraphy. For the Mesozoic, most of these sections happen to have been chosen in NW Europe. Another reason for the Eurocentricity of the Jurassic sea-level curve was the limitations posed by the provinciality of the ammonite zones that do not permit precise correlations for a truly globally based chronology of eustatic events. These correlations become somewhat easier in the latest Jurassic (Tithonian) where one can draw on multiple correlative tools, but for much of the Jurassic the correlation limitations persist. In the current synthesis, all available additional studies in Jurassic stratigraphic sections (from 1988 through 2017) with good biostratigraphic data were reevaluated. As a result, the correlation net has now been widened somewhat to include other areas to the east in the Tethyan realm and to the Southern Hemisphere; i.e., Argentina’s Neuquén Basin, where a nearly complete Jurassic record is preserved (e.g., Legarreta and Uliana, 1996). The heavy dependence on ammonite zones for correlation means that there is a built-in uncertainty in the ages of the sequence boundaries. While the sequence boundaries are placed according to their relative stratigraphic position within an ammonite zone (e.g., at the base, middle, top, or at the zonal boundary), theoretically the error bar could extend to the entire duration of the zone or subzone in question.
The long-term sea-level trends are similar to those shown in Haq et al. (1987, 1988) and Hardenbol et al. (1998). The original long-term curve for the Jurassic was based on continental flooding data, but unlike the Cretaceous (see Haq, 2014), knowledge of the oceanic crustal production rates for the Jurassic (i.e., variations in the mean age of the oceanic lithosphere, variations in the production rates at mid-ocean ridges, duration of the emplacement of seamounts, and large igneous provinces on the seafloor) is fragmentary because most of the seafloor of Jurassic age has since been subducted.
The documentation of the shorter-term sea-level changes (third-order events) are, of course, based on sequence-stratigraphic information from some relatively longer duration sections, but in most locations this information is pieced together from several sections within the Jurassic. Data from these studies were evaluated (and sequence-stratigraphically reinterpreted, as needed) before inclusion in the current synthesis. The Jurassic paleontological cross-correlations (i.e., zonal schemes based on different fossil groups and in different regions; Hardenbol et al., 1998) proved to be invaluable in aiding correlations in some cases. The sequence-stratigraphic interpretation criteria are well established and do not need repetition; however, in addition to these, other lithological and paleontological criteria (originally listed in Haq and Schutter, 2008; Haq, 2014) can also aid in the identification of system tracts, depositional surfaces, and sequence boundaries in outcrop and well-log sections. These include forced regressive facies, condensed section deposits, transgressive coals, evaporites, carbonate megabreccias, exposure-related deposits (i.e., incised valley fills, autochthonous coals, eolian sandstones, and karst in carbonates), as well as laterite/bauxite deposits. General trends in oxygen-isotopic data, in as much as they reflect broad climatic trends, can also lend greater confidence to the longer-term eustatic trends, and when the shorter-term isotopic excursions are distinctive, they can aid in the positioning of the timing of the sequence boundaries within a long-duration biostratigraphic zone (see Haq, 2014, for further discussion). In this synthesis, δ18O isotopic data from Jurassic belemnites collected from the European sections (from the Sinemurian through Tithonian interval; see Martinez and Dera, 2015) were plotted against the sea-level curve (and smoothed by Robust Lowess Regression) for comparison (see GSA Data Repository Fig. S1 1 ). The general trends in these data (which represent broad climatic variations) show an apparent similarity to the long-term sea-level curve, even though the ice-volume component in the oxygen-isotopic signal is considered negligible in the Jurassic.
--------
1 GSA Data Repository Item 2017387, documentation of depositional sequences comprising the new Jurassic sea-level curve, is online at www.geosociety.org/pubs/ft2017.htm.
An examination of the available sequence-stratigraphic reports of the Jurassic (up to 2017) revealed that many sections around the world cannot be correlated with precision with the European stage stratotypes due to the provincial nature of ammonites, though other fossil groups can be helpful for cross-correlations. The earlier syntheses presented by Haq et al. (1988) and Hardenbol et al. (1998) still form the basis of the current synthesis. Additional information on third-order sequences that form a part of this reappraisal comes from Britain and France (Wignall, 1991, from Kimmeridgian of Dorset and France; Partington et al., 1993, Kimmeridgian to Ryazanian of North Sea; Herbin et al., 1995, Kimmeridgian and Tithonian of Dorset and Yorkshire in the UK and Boulonnais Basin in France; Taylor et al., 2001, Late Jurassic of Wessex-Weald Basin; Williams et al., 2001, Kimmeridgian and Tithonian of Wessex Basin; Hesselbo, 2008, from the Jurassic onshore sections of Britain); Poland (Pienkowski, 2004, Early Jurassic of Polish Basins); Greenland (Surlyk, 1990, Jurassic of East Greenland); Russia (Sahagian et al., 1996, mid- to Late Jurassic of Russian Platform; Pinous et al., 1999, Callovian to Oxfordian of western Siberia); Portugal (Leinfelder, 1993, Kimmeridgian of Lusitanian Basin); Denmark (Johannessen et al., 1996, and Johannessen, 2003, Late Jurassic of North Sea and Danish Central Graben); and northern Switzerland (Gygi et al., 1998, Oxfordian-Kimmeridgian; Colombié and Ramell, 2007, Kimmeridgian). Other areas of the Tethys include the Arabian Platform (Sharland et al., 2001, 2004; Haq and Al-Qahtani, 2005, mid- to Late Jurassic; Al-Husseini and Matthews, 2006, Oxfordian–early Kimmeridgian), and India (Krishna, 2005, mid- to Late Jurassic of Kutch Basin). For the depositional cycles identified in Tibet, where a nearly complete Jurassic record exists (Li and Grant-Mackie, 1993), direct correlation with the sub-boreal third-order cycles of Europe and those from the western Tethys could not be established due to differences in ammonite assemblages, but the authors show similarity in trends, and even tie some of the major sequence boundaries with those in Europe. From the Southern Hemisphere the only data that could be considered for this synthesis come from Argentina (Mitchum and Uliana, 1985; Legarreta and Uliana, 1996, Jurassic of the Neuquén Basin). A number of other studies of the Jurassic that were undertaken at the broader (second-order) scales were not considered relevant for a third-order scale synthesis, but they do sometimes provide additional constraints for the long-term trends. As our ability to more precisely correlate sequences improves in the future (through ancillary fossil biozones and other multiple, overlapping, correlative criteria, such as chemostratigraphic methods), these depositional cycles may be extended to other parts of the globe where the marine Jurassic record is well preserved, such as New Zealand.
Results
The cycle chart resulting from the reappraisal of global stratigraphic data of the Jurassic is presented as two figures (Fig. 1 for the Early Jurassic and Fig. 2 for the Middle and Late Jurassic). The figures represent the established biochronostratigraphy of the Jurassic, plotted against the results of the current synthesis of the sequence cycles, their revised ages (and an updated numbering system partly adapted from Hardenbol et al., 1998). A sea-level curve based on the onlap record is the final product of the synthesis. The biochronostratigraphic parts of the figures show the latest (GTS 2016 of Ogg et al., 2016) age model from the Rhaetian (latest Triassic stage) through Berriasian (the early Cretaceous stage). This is tied to a composite paleomagnetic reversal scale that remains tentative below the Bajocian. The seafloor magnetic anomaly record is fragmentary below this level because the older Jurassic oceanic lithosphere has been largely subducted. Even for the Bajocian through Tithonian interval, it is dependent on a single site from the eastern Pacific (ODP site 801). The polarity scale from the Oxfordian to Tithonian is, nevertheless, fairly well verified in multiple sections and basins. The stages, Hettangian to Tithonian, currently considered standard subdivisions for the Jurassic, are tied to ammonite zones that, much like in the Cretaceous, are the most common fossil group for correlation in the Jurassic. The cross-correlation between zones from the relatively warm-water Tethyan regions and cooler-water boreal/sub-boreal regions (though still a part of the western Tethys) follow those suggested by Hardenbol et al. (1998) and later by Ogg and Hinnov (2012). Calcareous nannofossil zones of the Jurassic, also included, are mostly of long duration and of limited correlative utility in this period. However, sometimes they do provide additional criteria for correlations.
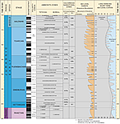 Figure 1
Early Jurassic sequences and variations of sea level. Time scale after Ogg et al. (2016). Biozone cross-correlations are after Hardenbol et al. (1998). Sequence boundaries (sea-level fall events) are redesignated following a numbering scheme suggested by Hardenbol et al. (1998) and Snedden and Liu (2010); however, the letters Tr, J, and K are prefixed to each designation for convenience to make the numbers unique and not to confuse them with similar numbers in other periods. (Three events in the Toarcian [JTo5–JTo7] are included provisionally, pending documentation of more widespread occurrence.)
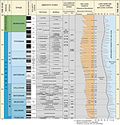 Figure 2
Middle–Late Jurassic sequences and variations of the sea level. (See Fig. 1 caption for details.)
The two columns on the right in Figures 1 and 2 show sea-level events (mostly third-order and some consistent fourth-order sequence boundaries) and sea-level curves (long-term and short-term) for the Jurassic. When sequence boundaries are correlatable in several basins they are considered widespread (though global validity cannot be verified due to the Eurocentric nature of most of the data). The criteria for the long-term curves (shown in the last column on the right) have been discussed earlier in this paper, and the shorter-term sea-level curve that is derived from the sequence-stratigraphic data to its left. The amplitudes of third-order sea-level changes (rise and falls in meters) shown here are averaged from stratigraphic estimates in several basins and should be considered approximate (see discussion in Haq, 2014). They are subdivided into three magnitude categories of sea-level falls: major (>75 m), medium (25–75 m), and minor (<25 m). Most sea-level events fall within the medium category.
The long-term sea-level envelope (indicating the maximum flooding of continental margins and interior basins) shows that sea level remained close to or below present-day mean sea level (pdmsl) from the latest Triassic through the Hettangian and early Sinemurian, rising only a few tens of meters above pdmsl in the late Sinemurian-Pliensbachian, and by the late Pliensbachian it reverted back to levels comparable to pdmsl. In the Toarcian, there is an apparent long-term rise that may have peaked at ~75 m above pdmsl. In the latest Toarcian, the sea levels fell again to a few tens of meters above pdmsl, a trend that continued into the early Aalenian. From the late Aalenian onward, there is a gradual sea-level rise trend, with a few tens of meters of dip in the Bajocian and another in the latest Callovian–earliest Oxfordian that culminated in the peak high of the Jurassic in the late Kimmeridgian–early Tithonian. Near the Kimmeridgian-Tithonian boundary, the sea level may have been as high as ~140 m above pdmsl. In the late Tithonian, the sea level is seen to fall somewhat (from the peak high to ~100 m above pdmsl at the Tithonian-Berriasian boundary) before stabilizing in the earliest Cretaceous at ~110 m above pdmsl. It needs to be underscored that these amplitudes are at best guesstimates based on available data, which are not always definitive.
As mentioned, the short-term sea-level curve is largely a record of the third-order events (modeled as temporary removal or storage of water causing sea-level falls) that have been documented consistently in several basins and are thus considered widespread. These third-order events show variation in both the duration and magnitude of sea-level falls. The timing of the sea-level falls is accurate within a biozone (or subzone), but their numerical placement is approximated from their position in the outcrop sections (when sedimentation rates can be calculated), and sometimes when oxygen-isotopic data are available that show distinct excursions from the overall trends (see the GSA Data Repository [see footnote 1]). The magnitude (amplitude) of sea-level falls as shown on the curves is, however, more difficult to estimate and has to be averaged from several sections (see discussion in Haq, 2014). Fifty-six third- and eight fourth-order consistently occurring events have been identified in the Jurassic of the sub-boreal and Tethyan regions, of which 25 are additional to the older synthesis (Haq et al., 1988). Three events in the Toarcian (JTo5–JTo7) are included here tentatively, pending wider confirmation. Fourteen sea-level falls are considered as major, with drawdown of more than 75 m (JSi4 in Sinemurian; JPl2 and JPl8 in Pliensbachian; JAa2, JAa3 in Aalenian; JBj1 at the base of Bajocian; JOx1, JOx5, JOx6, JOx7 in Oxfordian; JKi7 in Kimmeridgian; and JTi3, JTi4, JTi5 in Tithonian). All other events are within the medium or minor range. The amplitude of sea-level falls is estimated to range from as little as <25 m for minor falls, to as much as ~150 m for major falls. The average duration of the third-order events is just over a million years, while fourth-order events average at ~410 k.y. Much like the Cretaceous (see Haq, 2014), the fourth-order cyclicity also seems to be a common feature in the Jurassic and is observable locally in sections with relatively high sedimentation rates. This higher-order cyclicity is considered to represent the long-period orbital eccentricity control on depositional cycles.
Discussion and Conclusions
The causes for third-order cyclicity in the Jurassic, in a period where there is little direct evidence of major ice sheets, remain unresolved (see a discussion in Haq and Huber, 2016). A variety of solid-Earth tectonic influences can affect sea-level changes (see, e.g., Conrad, 2013; Haq, 2014). But these influences can only provide some explanations for the local, very short time-scale changes of hundreds of years to 100 k.y. (such as those due to isostatic elastic and viscous responses of the lithosphere due to ice and water loading and unloading), or for the widespread but much longer time-scale changes on multiple millions of years (see a discussion in Haq, 2014, and Cloetingh and Haq, 2015). They fail to account for changes on third-order time scales of ~1 m.y./cycle. As an example, dynamic topography (see, e.g., Gurnis, 1993; Flament et al., 2013) can explain the reasons for the amplitude disparities of sea-level falls as measured physically along different margins, but the time scales involved in dynamic topographic changes are several million years and do not shed light on third-order cyclicity. The conclusions reached in the earlier synthesis of Cretaceous cyclicity (Haq, 2014; Cloetingh and Haq, 2015) that all measures of sea-level change are eurybatic (i.e., local or regional), and that an estimate of eustatic amplitude of sea-level falls cannot be inferred from any single basin or continental margin and must be averaged from global data, are valid for the Jurassic as well. The current synthesis reinforces these inferences. Jurassic sections also display the fourth-order cyclicity of ~410 k.y. whenever the sedimentation rates are high enough to resolve higher-resolution cycles. This periodicity is presumed to be driven by long-term orbital eccentricity, and its occurrence in the Jurassic as well as other periods supports the conclusion that the 410-k.y. periodicity may be considered as a basic element of most sequences, controlled largely by the long-term climatic trends.
Acknowledgments
This paper is dedicated to the memory of a fellow paleoceanographer and friend, Wolfgang Berger, a scientist extraordinaire, who generously shared his insights with all his colleagues. The author extends his thanks to Mathieu Martinez and Guillaume Dera for providing the stable isotopic data on European belemnites from the Jurassic. Special thanks are due to James Ogg, and two anonymous reviewers, for the detailed review and many suggestions that improved this paper. Thanks are also due to Alexandre Lethiers (University of Pierre and Marie Curie, Paris) for carefully drafting the sea-level curves through several iterations.
References Cited
- Al-Husseini, M., and Matthews, R.K., 2006, Stratigraphic note: Orbital calibration of the Arabian Jurassic second-order sequence stratigraphy: GeoArabia, v. 11, no. 3, p. 161–170.
- Brigaud, B., Puceat, E., Pellenard, P., Vincent, B., and Joachimski, M.M., 2008, Climatic fluctuations and seasonality during Late Jurassic inferred from δ18O of Paris Basin oyster shells: Earth and Planetary Science Letters, v. 273, p. 58–67, https://doi.org/10.1016/j.epsl.2008.06.015.
- Cloetingh, S., and Haq, B.U., 2015, Inherited landscapes and sea level change: Science, v. 347, no. 6220, 1258375, https://doi.org/10.1126/science.1258375.
- Colombié, C., and Rameil, N., 2007, Tethyan-to-boreal correlation in the Kimmeridgian using high-resolution sequence stratigraphy (Vocontian Basin, Swiss Jura, Boulonnais, Dorset) [Geologische Rundschau]: International Journal of Earth Sciences, v. 96, p. 567–591, https://doi.org/10.1007/s00531-006-0117-3.
- Conrad, C.P., 2013, The solid Earth’s influence on sea level: Geological Society of America Bulletin, v. 125, p. 1027–1052, https://doi.org/10.1130/B30764.1.
- Dera, G., Pucéat, E., Pellenard, P., Neige, P., Delsate, D., Joachimski, M.M., and Martinez, M., 2009, Water mass exchange and variations in seawater temperature in the NW Tethys during the Early Jurassic: Evidence from neodymium and oxygen isotopes of fish teeth and belemnites: Earth and Planetary Science Letters, v. 286, no. 1–2, p. 198–207, https://doi.org/10.1016/j.epsl.2009.06.027.
- Dromart, G., Garcia, J.P., Picard, S., Atorps, F., Lecuyer, C., and Sheppard, S.M.F., 2003, Ice age at the Middle-Late Jurassic transition: Earth
- and Planetary Science Letters, v. 213, p. 205–220, https://doi.org/10.1016/S0012-821X(03)00287-5.
- Flament, N., Gurnis, M., and Dietmar Mueller, R., 2013, A review of observations and models of dynamic topography: Lithosphere, v. 5, p. 189–210, https://doi.org/10.1130/L245.1.
- Frakes, L.A., Francis, J.E., and Syktus, J.I., 1992, Climate modes of the Phanerozoic: The history of the Earth’s climate over the past 600 million years: Cambridge, Cambridge University Press, 274 p., https://doi.org/10.1017/CBO9780511-628948.
- Gurnis, M., 1993, Phanerozoic marine inundation of continents driven by dynamic topography above subducting slabs: Nature, v. 364, p. 589–593, https://doi.org/10.1038/364589a0.
- Gygi, R.A., Coe, A.L., and Vail, P.R., 1998, Sequence stratigraphy of the Oxfordian and Kimmeridgian stages (Late Jurassic) in northern Switzerland, in De Graciansky, P.-C., Hardenbol, J., Jacquin, T., and Vail, P.R. eds., Mesozoic and Cenozoic Sequence Stratigraphy of European Basins: Tulsa, Oklahoma, SEPM Special Publication 60, p. 3–29.
- Hallam, A., 1978, Eustatic cycles in the Jurassic: Palaeogeography, Palaeoclimatology, Palaeoecology, v. 23, p. 1–32, https://doi.org/10.1016/0031-0182(78)90079-2.
- Hallam, A., 2001, A review of the broad pattern of Jurassic sea-level changes and their possible causes in the light of current knowledge: Palaeogeography, Palaeoclimatology, Palaeoecology, v. 167, no. 1–2, p. 23–37, https://doi.org/10.1016/S0031-0182(00)00229-7.
- Haq, B.U., 2014, Cretaceous eustasy revisited: Global and Planetary Change, v. 113, p. 44–58, https://doi.org/10.1016/j.gloplacha.2013.12.007.
- Haq, B.U., and Al-Qahtani, A.M., 2005, Phanerozoic cycles of sea-level change on the Arabian Platform: GeoArabia, v. 10, no. 2, p. 127–160.
- Haq, B.U., and Huber, B.T., 2016, Anatomy of a eustatic event during the Turonian (Late Cretaceous) hot greenhouse climate: Science China, Earth Sciences, v. 60, p. 20–29, doi:10.1007/s11430-016-0166-y.
- Haq, B.U., and Schutter, S.R., 2008, A chronology of Paleozoic sea-level changes: Science, v. 322, no. 5898, p. 64–68, https://doi.org/10.1126/science.1161648.
- Haq, B.U., Hardenbol, J., and Vail, P.R., 1987, The chronology of fluctuating sea level since the Triassic: Science, v. 235, p. 1156–1167, https://doi.org/10.1126/science.235.4793.1156.
- Haq, B.U., Hardenbol, J., and Vail, P.R., 1988, Mesozoic and Cenozoic chronostratigraphy and cycles of sea-level change: Society of Economic Paleontologists and Mineralogists Special Publication, v. 42, p. 71–108.
- Hardenbol, J., Thierry, J., Farley, M.B., Jacquin, T., De Graciansky, P.C., and Vail, P.R., 1998, Mesozoic and Cenozoic sequence chronostratigraphic framework of European basins: Society of Economic Paleontologists and Mineralogists Special Publication 60, p. 3–13 (Chart 6 Jurassic Chronostratigraphy).
- Herbin, J.P., Fernandez-Martinez, J.L., Geyssant, J.R., Albani, A.E., Deconinck, J.F., Proust, J.N., Colbeaux, J.P., and Vidier, J.P., 1995, Sequence stratigraphy of source rocks applied to the study of the Kimmeridgian/Tithonian in the north-west European shelf (Dorset/UK, Yorkshire/UK and Boulonnais/France): Marine and Petroleum Geology, v. 12, no. 2, p. 177–194, https://doi.org/10.1016/0264-8172(95)92838-N.
- Hesselbo, S.P., 2008, Sequence stratigraphy and inferred relative sea-level change from the onshore British Jurassic: Proceedings of the Geologists’ Association, v. 119, no. 1, p. 19–34, https://doi.org/10.1016/S0016-7878(59)80069-9.
- Hinnov, L.A., and Park, J.J., 1999, Strategies for assessing Early-Middle (Pliensbachian-Aalenian) Jurassic cyclochronologies: Philosophical Transactions of the Royal Society London, A: Mathematics: Physics and Engineering Science, v. 357, p. 1831–1859, https://doi.org/10.1098/rsta.1999.0403.
- Johannessen, P.N., 2003, Sedimentology and sequence stratigraphy of paralic and shallow marine Upper Jurassic sandstones in the northern Danish Central Graben. The Jurassic of Denmark and Greenland: Geological Survey of Denmark and Greenland Bulletin, v. 1, p. 367–402.
- Johannessen, P.N., Dybkjaer, K., and Rasmussen, E.S., 1996, Sequence stratigraphy of Upper Jurassic reservoir sandstones in the northern part of the Danish Central Trough, North Sea: Marine and Petroleum Geology, v. 13, no. 7, p. 755–770, https://doi.org/10.1016/0264-8172(96)00024-4.
- Korte, C., and Hesselbo, S.P., 2011, Shallow marine carbon and oxygen isotope and elemental records indicate icehouse-greenhouse cycles during the Early Jurassic: Paleoceanography, v. 26, 18 p., https://doi.org/10.1029/2011PA002160.
- Korte, C., Hesselbo, S.P., Ullmann, C.V., Dietl, G., Ruehl, M., Scweigert, G., and Thibault, N., 2015, Jurassic climate mode governed by ocean gateway: Nature Communications, v. 6, 10015, https://doi.org/10.1038/ncomms10015 (7 p. plus two online supplements).
- Krishna, J., 2005, Update of Kutch Jurassic ammonoid zonation: Summarised intra-basinal to global perspectives, in Raju, D.S.D., Peters, J., Shanker, R., and Kumar, G., eds., An overview of litho-bio-chrono-sequence stratigraphy and sea level changes of Indian sedimentary basins: Association of Petroleum Geologists Special Publication 1, p. 76–79.
- Legarreta, L., and Uliana, M.A., 1996, The Jurassic succession in west-central Argentina: Stratal patterns, sequences, and paleogeographic evolution: Palaeogeography, Palaeoclimatology, Palaeoecology, v. 120, p. 303–330, https://doi.org/10.1016/0031-0182(95)00042-9.
- Leinfelder, R.R., 1993, A sequence stratigraphic approach to the Upper Jurassic mixed carbonate-siliciclastic succession of the central Lusitanian Basin, Portugal: Profil, v. 5, p. 119–140.
- Li, X., and Grant-Mackie, J.A., 1993, Jurassic sedimentary cycles and eustatic sea-level changes in southern Tibet: Palaeogeography, Palaeoclimatology, Palaeoecology, v. 101, no. 1, p. 27–48.
- Martinez, M., and Dera, G., 2015, Orbital pacing of carbon fluxes by a ~9-My eccentricity cycle during the Mesozoic: Proceedings of the National Academy of Sciences of the United States of America, v. 112, no. 41, p. 12,604–12,609, https://doi.org/10.1073/pnas.1419946112.
- Mitchum, R.M., and Uliana, M.A., 1985, Seismic stratigraphy of carbonate depositional sequences, Upper Jurassic–Lower Cretaceous, Neuquén Basin, Argentina, in Berg, O., and Woolverton, D.G., eds.; Seismic Stratigraphy II: An Integrated Approach to Hydrocarbon Exploration: American Association of Petroleum Geologists Memoir 39, p. 255–275.
- Ogg, J.G., and Hinnov, L.A., 2012, Jurassic, in Gradstein, F.M., Ogg, J.G., Schmitz, M., and Ogg, G., eds., The Geologic Time Scale: Amsterdam, Elsevier, p. 731–791, https://doi.org/10.1016/B978-0-444-59425-9.00026-3.
- Ogg, J.G., Ogg, G., and Gradstein, F.M., 2016, A Concise Geologic Time Scale: Amsterdam, Elsevier, 240 p.
- Partington, M.A., Mitchener, B.C., Milton, N.J., and Fraser, A.J., 1993, Genetic sequence stratigraphy for the North Sea Late Jurassic and Early Cretaceous: Distribution and prediction of Kimmeridgian–Late Ryazanian reservoirs in the North Sea and adjacent areas: Geological Society, London, Petroleum Geology Conference Series, v. 4, p. 347–370.
- Pienkowski, G., 2004, The epicontinental Lower Jurassic of Poland: Polish Geological Institute Special Publication 12, p. 1–152.
- Pinous, O.V., Sahagian, D.L., Shurygin, B.N., and Nikitenko, B.L., 1999, High-resolution sequence stratigraphic analysis and sea-level interpretation of the middle and upper Jurassic strata of the Nyurolskaya depression and vicinity (southeastern West Siberia, Russia): Marine and Petroleum Geology, v. 16, no. 3, p. 245–257, https://doi.org/10.1016/S0264-8172(98)00078-6.
- Rogov, M.A., and Zakharov, V.A., 2010, Jurassic and Lower Cretaceous glendonite occurrences and their implication for Arctic paleoclimate reconstructions and stratigraphy: Earth Science Frontiers, v. 17, p. 345–347.
- Sahagian, D., Pinous, O., Olferiev, A., and Zakharov, V., 1996, Eustatic curve for the Middle Jurassic–Cretaceous based on Russian platform and Siberian stratigraphy: Zonal resolution: The American Association of Petroleum Geologists Bulletin, v. 80, no. 9, p. 1433–1458.
- Sellwood, B.W., and Valdes, P.J., 2008, Jurassic climates: Proceedings of the Geologists’ Association, v. 119, no. 1, p. 5–17, https://doi.org/10.1016/S0016-7878(59)80068-7.
- Sharland, P.R., Archer, R., Casey, D.M., Davies, R.B., Hall, S.H., Heward, A.P., Horbury, A.D., and Simmons, M.D., 2001, The chrono-sequence stratigraphy of the Arabian Plate: GeoArabia Special Publication 2, 371 p.
- Sharland, P.R., Casey, D.M., Davies, R.B., Simmons, M.D., and Sutcliffe, O.E., 2004, Arabian plate sequence stratigraphy—Revisions to SP2: GeoArabia, v. 9, no. 1, p. 199–214.
- Snedden, J., and Liu, C., 2010, A compilation of Phanerozoic sea-level change, coastal onlaps and recommended sequence designations: Search and Discovery Article, American Association of Petroleum Geologists, no. 40594, p. 1095–1122.
- Strasser, A., 2007, Astronomical time scale for the Middle Oxfordian to Late Kimmeridgian in the Swiss and French Jura Mountains: Swiss Journal of Geosciences, v. 100, no. 3, p. 407–429, https://doi.org/10.1007/s00015-007-1230-4.
- Suan, G., Mattioli, E., Pittet, B., Lécuyer, C., Suchéras-Marx, B., Duarte, L.V., Philippe, M., Reggiani, L., and Martineau, F., 2010, Secular environmental precursors to Early Toarcian (Jurassic) extreme climate changes: Earth and Planetary Science Letters, v. 290, no. 3–4, p. 448–458, https://doi.org/10.1016/j.epsl.2009.12.047.
- Surlyk, F., 1990, A Jurassic sea-level curve for East Greenland: Palaeogeography, Palaeoclimatology, Palaeoecology, v. 78, no. 1–2, p. 71–85, https://doi.org/10.1016/0031-0182(90)90205-L.
- Taylor, S.P., Sellwood, B.W., Gallois, A.W., and Chambers, M.H., 2001, A sequence stratigraphy of the Kimmeridgian and Bolonian stages (late Jurassic): Wessex-Weald Basin, southern England: Journal of the Geological Society, v. 158, p. 179–192, https://doi.org/10.1144/jgs.158.1.179.
- Vail, P.R., Mitchum, R.M., Jr., Todd, R.G., Widmeir, J.M., Thompson S., III, Sangree, J.B., Bubb, J.N., and Hatlelid, W.G., 1977, Seismic stratigraphy and global changes of sea level, in Payton, C.E., editor, Seismic Stratigraphy—Applications to Hydrocarbon Exploration: American Association of Petroleum Geologists Memoir 26, p. 49–212.
- Wignall, P.B., 1991, Test of the concepts of sequence stratigraphy in the Kimmeridgian (Late Jurassic) of England and northern France: Marine and Petroleum Geology, v. 8, no. 4, p. 430–441, https://doi.org/10.1016/0264-8172(91)90065-9.
- Williams, C.J., Hesselbo, S.P., Jenkyns, H.C., and Morgans-Bell, H.S., 2001, Quartz silt in mudrocks as a key to sequence stratigraphy (Kimmeridge Clay Formation, Late Jurassic, Wessex Basin, UK): Terra Nova, v. 13, no. 6, p. 449–455, https://doi.org/10.1046/j.1365-3121.2001.00378.x.
- Zakharov, V.A., Shurygin, B.N., Il’ina, V.I., 2006, Pliensbachian–Toarcian biotic turnover in North Siberia and the Arctic Region: Stratigraphy and Geological Correlation, v. 14, no. 4, p. 399–417, https://doi.org/10.1134/S0869593806040046.