
Full Text View
GSA Today
![]()
Article, pp. 4-9 | Abstract | PDF (2.9MB)
Dynamics and legacy of 4.8 ka rock avalanche that dammed Zion Canyon, Utah, USA
| Table of Contents |
|---|
|
Search GoogleScholar for
Search GSA Today |
Abstract
The Sentinel rock avalanche blocked the mouth of Zion Canyon, Utah, USA, over a distance of 3.3 km and created a large lake that filled the canyon floor with sediment, transforming this iconic desert landscape. However, key questions remain regarding the size, timing, and dynamics, as well as the geomorphic effects of this prominent landslide. Reconstructing topography before and after the failure, we calculate an original deposit volume of 286 million m3 with maximum thickness of 200 m. New cosmogenic nuclide surface exposure ages of 12 boulders from across the deposit reveal a mean age of 4.8 ± 0.4 ka and are consistent with single-event emplacement. Results of 3D numerical runout simulations agree well with mapped deposit boundaries and thickness, affirming our hypothesized failure scenario and indicating an average runout velocity of 50 m/s. Following partial breach of the landslide dam, we estimate that water levels stabilized for ~700 yr until the lake filled with sediment. Deposited lacustrine clays reveal a period when Zion Canyon was filled by the 3 km2 Sentinel Lake extending more than 7 km upstream. Today the Virgin River incises alluvial and lacustrine deposits still stranded behind remnants of the rock avalanche dam, attesting to the long-lasting geomorphic and ecological impacts of large landslides in steep desert landscapes.
* Corresponding author e-mail: jeff.moore@utah.edu
Manuscript received 12 Oct. 2015; accepted 11 Jan. 2016
doi: 10.1130/GSATG269A.1
INTRODUCTION
To the visitor viewing Zion National Park for the first time, there is a tantalizing similarity in shape between the sheer-walled gorge of Zion Canyon and the Yosemite Valley … The impression is so pronounced that the explanation of this similarity is a daily task for the members of the naturalist staff. —R.K. Grater (1945, p. 117)
Zion National Park, Utah, USA, receives millions of visitors annually, but few appreciate that the tranquil and inviting flat valley floor of Zion Canyon set amidst towering sandstone cliffs owes its origin to a large, prehistoric landslide (Fig. 1A). Many visitors identify deposits of smaller slides as they enter Zion Canyon (e.g., one that damaged the main road in 1995), climbing a winding roadway through blocky rock avalanche debris incised by the Virgin River (Fig. 1B). The scale of the Sentinel rock avalanche, however, evades easy perception—with visible deposits >2 km long, 1 km wide, and up to 200 m thick, the slide is approximately five times larger than the largest historic, non-volcanic landslides in North America (Grater, 1945; Pankow et al., 2014). Remnant clay beds and fossil mollusks preserved throughout the canyon reveal a period when Sentinel Lake occupied Zion Canyon for several centuries until eventually filling with sediment (Hamilton, 1976).
|
(A) View northeast (looking upstream into Zion Canyon) over the surface of the Sentinel rock avalanche deposit; incised gorge of the Virgin River at far right. Qsd—Sentinel rock avalanche deposits; Qts—sandy talus (see Fig. 2). (B) Rock avalanche deposits exposed by river incision, showing constituent rock types assessed from remote mapping; height of exposure is ~150 m. The upper part of the deposit consists primarily of Navajo Sandstone debris, which is characteristically shattered and compact, while the basal portion of the deposit consists of Kayenta material that has been deformed and tilted but often retains small-scale structure. See Figures 2 and 3 for composition of the source. |
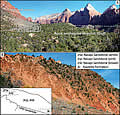 Figure 1
Catastrophic rock avalanches represent an extreme-magnitude natural hazard. Case histories illustrate the devastating consequences as millions of cubic meters of rock travel kilometers distance in only seconds, reaching peak velocities of ~100 m/s with flow-like characteristics (e.g., Crosta et al., 2004; Dunning et al., 2007). Beyond the immediate hazard, however, rock avalanches also have long-lasting geomorphic and ecological consequences, blocking river valleys and controlling local base-level for millennia, while facilitating human habitation and cultivation of otherwise steep terrain (Korup, 2006; Hewitt et al., 2011). This juxtaposition of modern-day hazard and geomorphic transformation is ideally captured in Zion Canyon; however, the related effects of transient landscape disturbance can be found in a wide range of environments (Korup et al., 2010), and the ecological effects of altered river courses may be especially relevant in desert canyons of the Colorado Plateau.
Previous efforts to date the Sentinel rock avalanche relied on radiocarbon from charcoal found in lacustrine and alluvial sediments. Hamilton (1976) determined an age of 3.4–4.5 cal. k.y. B.P. (recalculated calibrated 1 range using IntCal13; Reimer et al., 2013) for charcoal found in post-lake sand overlying clay beds. The Utah Geological Survey (UGS) reported ages of 7.2–9.0 and 7.0–8.3 cal. k.y. B.P. for charcoal found in lacustrine clay at 4 m and 10 m below ground level, respectively (Doelling et al., 2002) (see Fig. 2A). Most recently, Hamilton (2014) obtained a luminescence age of 4.3 ± 1.3 ka for sand between lacustrine clays near the top of the lake sequence. Taken together, these ages imply a nearly 4000-yr lifespan for Sentinel Lake. However, calculations of modern sediment flux for the Virgin River suggest that the lake filled with sediment in only 600–800 yr (Hamilton, 1976, and our new value described herein).
|
(A) Geological map of the study area (modified from Doelling et al. [2002] in the landslide area). Units: Qa—Quaternary alluvium; Qt—Quaternary talus (Qts—sandy talus cone at base of source); Qsd—deposits of the Sentinel rock avalanche (in places with >1 m of alluvium or colluvium cover); Jts—Temple Cap Formation; Jnw—Navajo Sandstone, white; Jnp—Navajo Sandstone, pink; Jnb—Navajo Sandstone, brown; Jkt—Kayenta Formation, Tenney Canyon Tongue; Jnl—Navajo Sandstone, Lamb Point Tongue; Jk—Kayenta Formation; Jms—Moenave Formation, Springdale Sandstone; Jmw—Moenave Formation, Whitmore Point Member; Jmd—Moenave Formation, Dinosaur Canyon Member. Orange squares are select exposures of Sentinel Lake clay beds; star shows location of Utah Geological Survey (UGS) core. Circles are cosmogenic exposure age sample locations. Contour interval is 30 m. (B) Results of cosmogenic surface exposure dating showing individual ages and errors, mean age (solid line) of 4.8 ka, and associated standard deviation (gray bar). Samples with open circles were deemed outliers (see text). (C) Estimated extents of Sentinel Lake at its initial high-stand (water level ~1420 m) and later stable level (~1345 m). |
 Figure 2
In this paper, we report new mapping of Sentinel rock avalanche deposits and select lacustrine sediments. We approximate the topography of Zion Canyon before and after the slide to generate refined estimates of the rock avalanche volume and to comment on failure kinematics. We then use cosmogenic nuclide surface exposure dating to provide the first direct date of the rock avalanche deposit and constrain the age of Sentinel Lake. Numerical runout simulation helps confirm the hypothesized single-event, catastrophic failure scenario. Long-lasting geomorphic and ecological effects contributing to the iconic setting of Zion National Park attest to the diverse impacts of large rock avalanches in steep desert landscapes.
Sentinel Rock Avalanche
Deposits of the Sentinel rock avalanche are deeply incised by the Virgin River, providing exceptional exposures over a distance of ~2 km (Figs. 1 and 2). We observed large-scale remnant stratification reflecting the composition of the source: Kayenta Sandstone from the base of the source is generally found along the basal portion of the deposit, while Navajo Sandstone from the top of the source forms the upper part of the deposit (for details of these lithologies see Doelling et al., 2002). Moreover, the two materials exhibit strong textural differences caused by rock avalanche emplacement: the Kayenta Sandstone, with higher clay content, is highly deformed but frequently retains remnant centimeter-scale sedimentary structure, while the massive and relatively homogenous Navajo Sandstone exhibits compact and shattered, clast-supported deposits. Navajo Sandstone in Zion Canyon appears white in the upper part of the formation, transitioning to pink and brown below through diagenetic leaching of iron (Nielsen et al., 2009). Boulders of each diagenetic facies are found within the deposit (Fig. 1B).
To quantify the volume of the rock avalanche, we reconstructed topography beneath the deposit and immediately after failure. Our reconstruction is based on field assessments, exposed outcrops, and extrapolation from nearby slopes. A key marker is a ~30 m thick bed of Springdale Sandstone, a member of the Moenave Formation, which dips gently (~2°) to the northeast (Fig. 2A) (Doelling et al., 2002). We assume the failure surface did not penetrate this layer, because in-place outcrops are exposed at the base of the rock avalanche deposit. Another key element in our reconstruction is a large bedrock arm flanking the southwestern end of the deposit; here we mapped bedrock along the river gorge and under thin colluvium on two knobs above rock avalanche debris (see Fig. 2A). Aided by long-profile extrapolation of the Virgin River underneath the slide (Fig. 3A), we approximated the topography below deposits of the Sentinel rock avalanche (Fig. 3B). To reconstruct the top of the slide debris, we extrapolated existing surfaces across the incised Virgin River gorge.
|
(A) Long-profile of the Virgin River (V.R.) from The Narrows to the town of Springdale, with extrapolated pre-slide profile (black dashed line). Reconstructed top of rock avalanche deposits is compared to modeled profile. Inset shows simplified schematic of the UGS core. Clay lake bed deposits are projected onto the long-profile. 36× vertical exaggeration. (B) Cross section through the Sentinel rock avalanche deposit showing reconstructed base of slide, top of slide, and original valley profile, compared to model results and modern topography. Qts—sandy talus cone at base of source; Jts—Temple Cap Formation; Jnw—Navajo Sandstone, white; Jnp—Navajo Sandstone, pink; Jnb—Navajo Sandstone, brown; Jkt—Kayenta Formation, Tenney Canyon Tongue; Jnl—Navajo Sandstone, Lamb Point Tongue; Jk—Kayenta Formation; Jms—Moenave Formation, Springdale Sandstone; no vertical exaggeration. |
 Figure 3
Subtracting the reconstructed basal topography from the top-of-slide debris surface, we calculated a mean and maximum deposit thickness of 95 m and 200 m, respectively (see Fig. 4F). The original deposit was 3.3 km long and 1.4 km wide, covered an area of 3 million m2, and had an estimated total volume of 286 million m3 (volume presumed accurate to within ±20% from trial solutions using alternate topographies). A minimum fahrboeschung angle (i.e., the ratio of fall height to path length along flow lines) of 20° for the Sentinel slide indicates relatively low mobility for this volume compared to other terrestrial events (Lucas et al., 2014). This may be related to the cross-valley flow orientation. Comparing the original volume of rock avalanche deposits to the volume of material found today, we estimate that approx. 131 million m3, or ~45%, of debris has been eroded by the Virgin River. We also estimate that ~5 million m3 have been added to the deposit in the sandy debris cone at the base of the source area (Fig. 2A), although the timing of this addition is uncertain.
|
DAN3D runout simulation of the Sentinel rock avalanche. Panels (A–E) show snapshots of the runout at indicated times. Thickness at 200 s represents final modeled values and has been bulked by 28% for comparison with mapped and reconstructed values (F). See the GSA Supplement Data Repository (see footnote 1) for animation. Shaded relief map and 30 m contours show recreated sliding surface topography. Thickness values <2 m have been omitted for clarity. |
 Figure 4
The rock avalanche source is revealed by the craggy, unweathered east face of the Sentinel; a series of broken pinnacles help delineate the scarp. The form of the original cliff, however, is not well constrained. We model the source form loosely after nearby Abraham Peak, which shares the same stratigraphy and regional joint patterns. We allow the source area to extend to 2150 m above sea level and assume common slope angles for the different lithologies (Fig. 3B). The kinematics of the release are similarly unknown. Based on topographic reconstruction, we place the lowest point of the failure surface near the base of the Kayenta Formation, which features alternating beds of sandstone and shale. Rotational or translational failure through the Kayenta likely exploited one or more weak shale layers. Our recreated source has a volume of 223 million m3, yielding an estimated volume increase of 28% as intact rock was converted to debris (typical fragmentation volume increase is ~25%; Hungr and Evans, 2004). The relatively flat and hummocky surface of the rock avalanche deposit, combined with a lack of internal erosional or depositional surfaces visible in outcrops, suggest single-event catastrophic failure and emplacement.
Surface Exposure Dating
We sampled 12 boulders from across the rock avalanche deposit for cosmogenic 10Be surface exposure dating (Fig. 2B; GSA Supplemental Data Repository1 Table S1). The boulders, which were predominantly Navajo Sandstone of each coloration facies, exhibited a range of bedding orientations and had average dimensions of several meters. We avoided boulders that were excessively friable or showed evidence of slabbing, excavation, or movement after deposition (Ivy-Ochs and Kober, 2008). Iron concretions in several sampled boulders are weathering resistant, projecting 1–2 cm above the surrounding rock and allowing estimates of boulder surface erosion since deposition. Sample preparation followed the procedures of Ivy-Ochs et al. (2006). 10Be/9Be AMS measurements were performed at ETH Zurich (Christl et al., 2013). Sample 10Be/9Be ratios were normalized to the ETH in-house standard S2007N, which is calibrated to 07KNSTD. The weighted mean full-process, measured blank 10Be/9Be ratio of (3.6 ± 2.6) × 10−15 was used for blank corrections. We calculated exposure ages with the CRONUS online calculator (Balco et al., 2008) using a spallation production rate of 3.93 ± 0.19 atoms g−1 a−1 of the northeast North America calibration data set (Balco et al., 2009) and a time-dependent spallation production model (Lal, 1991; Stone, 2000). Several of the quartz mineral separates had high B contents, leading to large AMS uncertainties for a few samples. Final exposure ages are shown in Figure 2B; input data and calculation results are reported in Supplemental Table S1 (see footnote 1).
1 GSA Supplemental Data Item 2016070, including cosmogenic nuclide surface exposure dating sample details and results, as well as animation of the simulated Sentinel rock avalanche, is online. You can also request a copy from GSA Today, P.O. Box 9140, Boulder, CO 80301-9140, USA; gsatoday@geosociety.org.
Exposure dating revealed that boulders from across the surface of the slide were deposited simultaneously, indicating a single-event, massive, and catastrophic rock slope failure. We identified three outliers in our dating results: boulder Z1, which had large measurement uncertainty due to high boron content; Z4, with likely inheritance from pre-slide exposure; and Z8, which was highly weathered with possible inheritance. The remaining nine ages are consistent, indicating a mean age of 4.8 ± 0.4 ka (error: ±1). No evidence for a concurrent paleo-seismic event in the area has been identified, which might have triggered the rock avalanche (Stenner et al., 1999).
Runout Modeling
We performed numerical runout simulation of the Sentinel rock avalanche using the equivalent-fluid code DAN3D (McDougall and Hungr, 2004). Our goal was to reproduce the observed deposit extents and thickness, and in doing so validate the hypothesized single-event failure scenario. DAN3D allows modeling of rock avalanche motion over 3D terrain based on input of slide path topography, source thickness, and material properties. We used a modified version of DAN3D that allows initial rigid-body motion (Aaron and Hungr, 2014). We selected a Voellmy rheology for basal shear resistance and assigned uniform material properties across the runout path. The best-fitting input parameters were (1) Voellmy friction coefficient f = 0.27 and turbulence parameter = 200; (2) unit weight = 20 kN/m3; and (3) an internal friction angle i = 35°. The relatively high Voellmy friction coefficient for the Sentinel rock avalanche (cf. Hungr and Evans, 1996) indicates comparably low mobility, which is due in part to the cross-valley flow orientation and likely dry rock avalanche and substrate materials.
Runout modeling results for the Sentinel rock avalanche are shown in Figure 4 (see also animation in the Supplemental Data Repository [see footnote 1]). After 4.5 s of initial rigid-body displacement (~20 m southeast), the mass collapses, fluidizes, and rapidly accelerates. The ensuing rock avalanche travels predominantly southeast, crossing Zion Canyon in less than 20 s with maximum velocity of 90 m/s and energetic runup on the opposite valley wall. Debris then spreads laterally up and down canyon. After ~50 s, the distal ends of the deposit have been reached and most of the material has come to rest, traveling a maximum source-toe path distance of 2.4 km at an average velocity of ~50 m/s. The modeled deposit boundaries match well with those mapped in the field (Figs. 4E and 4F), although our simulated deposit exceeds the mapped boundaries in areas to the east and southwest. Excessive material spreading in the initial part of our simulation may account for some of this discrepancy. The thickness and overall distribution of mass within the simulated deposit also match well with our topographic reconstruction. Independent velocity constraint can be obtained from estimated runup (h) on the opposing valley wall as: V = (2ghmax)0.5 (Jibson et al., 2006), where g is gravity and hmax = 200 m, indicating a minimum velocity needed to achieve this runup of 62 m/s (value does not account for basal shear resistance).
Sentinel Lake
The Sentinel rock avalanche blocked Zion Canyon over a distance of more than 3 km, damming the Virgin River and creating a lake. We estimate an initial breach elevation of the landslide dam of 1420 m, which is lower than the maximum height of ~1445 m and corresponds to a topographic low in the northern-central region of the deposit. At this initial level, Sentinel Lake would have covered an area of ~6.2 km2 (Fig. 2C). Assuming that discharge of the Virgin River was similar to modern mean values (USGS, 2014), we estimate that ~5–10 yr were required to fill the lake to this high-stand.
Preserved clay beds and mollusks indicate that a calm, deep-water environment was sustained by Sentinel Lake for several centuries (Hamilton, 1976, 2014). Lake-bed deposits are found as low as 1285 m (UGS core log data) and as high as 1315 m (Fig. 3), representing at least 30 m maximum thickness. Core and surface observations show that these clay beds are gray and yellow in color and layered at the centimeter scale. We estimate an approximate stable water elevation for Sentinel Lake of 1345 m based on the maximum elevation of identified clay deposits and morphology of the landslide dam. Field evidence of debris slumps and clay-filled channels indicates that this elevation varied slightly over time. At this water level, Sentinel Lake would have covered an area of ~3 km2, extending >7 km upstream (Fig. 2C).
Deposition of sediment behind the rock avalanche dam began to fill Sentinel Lake. Using modern sediment yields measured at the nearby East Fork of the Virgin River (Andrews, 2000), rescaled for the (nearly identical) North Fork drainage area, we calculate that Sentinel Lake would have filled with sediment in ~600–800 yr. This value matches a previous estimate by Hamilton (1976), which was generated from different data. Thus, from its formation at 4.8 ka, we estimate that Sentinel Lake occupied Zion Canyon for ~700 yr until ca. 4.1 ka. This timing is consistent with Hamilton’s (2014) OSL age of 4.3 ka, as well as Hamilton’s (1976) median radiocarbon age of 4.0 cal. k.y. B.P. for post-lake deposition of sand. Our results are not consistent with UGS radiocarbon ages, measured from extremely small charcoal samples in cored lake sediments, which placed the date of lake formation at ca. 8 ka.
Continued incision of the rock avalanche dam has resulted in erosion of alluvial and lacustrine sediments deposited up to 7 km upstream (Fig. 3A). In the area of Zion Lodge, the river now lies ~25 m below the highest alluvial sediments associated with the slide. As local base level continues to drop, this material will ultimately be lost, and the canyon will return to the steep and narrow form seen in nearby tributaries. Based on observed rates of post-slide erosion, this process is expected to require several millennia. The transient disturbance to the Virgin River drainage basin created by the Sentinel rock avalanche may thus control upstream base-level and prohibit fluvial incision of bedrock for >10 ka (cf. Hewitt et al., 2011).
Conclusions
The flat valley floor of modern Zion Canyon owes its origin to a 286 million m3 rock avalanche at 4.8 ka arising from the catastrophic collapse of a nearly 900-m-high wall of predominantly Navajo Sandstone. Aided by weak layers in the underlying Kayenta Formation, the failure sent material across the canyon at speeds possibly reaching 90 m/s; some deposits retain portions of their original stratigraphy although in a highly deformed state. Field mapping, runout modeling, and cosmogenic nuclide dating support our hypothesis of single-event, catastrophic emplacement of rock avalanche debris. Zion Canyon was blocked over a distance of 3.3 km, damming the Virgin River and creating a lake. At its high-stand, Sentinel Lake may have covered more than 6 km2, including all of Zion Canyon to The Narrows, but this water level was short-lived as incision of slide debris lowered the breach elevation to ~1345 m. There Sentinel Lake stood relatively stable for ~700 yr until filling with sediment. Today, incision of the rock avalanche dam continues, lowering the base-level of the Virgin River and causing erosion of lacustrine and alluvial materials upstream in Zion Canyon.
Large rock avalanches represent an infrequent but extreme-magnitude hazard in Zion National Park. Our study helps address the dynamics and timing of one such event in the densely utilized area of Zion Canyon; however, deposits of several other large valley-blocking landslides have been documented in the park (Hamilton, 2014). One similar event is the Hop Valley rock avalanche, with an estimated volume in the range of 50 million m3 and minimum age constrained by radiocarbon dating as ~2.6 k.y. B.P. The consequences of a similar event occurring today, especially within the narrow confines of Zion Canyon, could be disastrous. Moreover, smaller recent landslides have caused notable damage; for example, the 1995 Virgin River slide (Figs. 1A and 3A) affected Zion Canyon’s access road, requiring extensive repairs, while the 1990 Middle Fork Taylor Creek slide dammed a remote canyon, which drained suddenly three years later, creating a debris flow that impacted vehicles on a nearby interstate (Lund et al., 2010). Recognition of these hazards, combined with detailed field investigation, dating, and runout analysis, are the first steps toward mitigating landslide risks.
Acknowledgments
We are indebted to Wayne Hamilton and Dave Sharrow for many motivating and fruitful discussions. Johnny Sanders provided valuable input on our text; Greg McDonald, Tyler Knudsen, and Ali Sherman helped in the field. This study was funded in part by the David and Inga Chapman Fund. Comments from Jeff Coe and two anonymous reviewers are greatly appreciated.
References Cited
- Aaron, J., and Hungr, O., 2014, Simulation of the motion of semi-coherent landslides, in Geohazards 6: 6th Canadian GeoHazards Conference, Kingston, Ontario, Canada.
- Andrews, E.D., 2000, Bed material transport in the Virgin River, Utah: Water Resources Research, v. 36, p. 585–596, doi: 10.1029/1999WR900257.
- Balco, G., Stone, J.O., Lifton, N.A., and Dunai, T.J., 2008, A complete and easily accessible means of calculating surface exposure ages or erosion rates from Be-10 and Al-26 measurements: Quaternary Geochronology, v. 3, p. 174–195, doi: 10.1016/j.quageo.2007.12.001.
- Balco, G., Briner, J., Finkel, R.C., Rayburn, J.A., Ridge, J.C., and Schaefer, J.M., 2009, Regional beryllium-10 production rate calibrations for late-glacial northeastern North America: Quaternary Geochronology, v. 4, p. 93–107, doi: 10.1016/j.quageo.2008.09.001.
- Christl, M., Vockenhuber, C., Kubik, P.W., Wacker, L., Lachner, J., Alfimov, V., and Synal, H.A., 2013, The ETH Zurich AMS facilities: Performance parameters and reference materials: Nuclear Instruments & Methods in Physics Research. Section B, Beam Interactions with Materials and Atoms, v. 294, p. 29–38, doi: 10.1016/j.nimb.2012.03.004.
- Crosta, G.B., Chen, H., and Lee, C.F., 2004, Replay of the 1987 Val Pola landslide, Italian Alps: Geomorphology, v. 60, p. 127–146, doi: 10.1016/j.geomorph.2003.07.015.
- Doelling, H.H., Willis, G.C., Solomon, B.J., Sable, E.G., Hamilton, W.L., and Naylor II, L.P., 2002, Interim Geologic Map of the Springdale East Quadrangle, Washington County, Utah: Utah Geological Survey Open File-Report 393, 23 p.
- Dunning, S.A., Mitchell, W.A., Rosser, N.J., and Petley, D.N., 2007, The Hattian Bala rock avalanche and associated landslides triggered by the Kashmir earthquake of 8 October 2005: Engineering Geology, v. 93, p. 130–144, doi: 10.1016/j.enggeo.2007.07.003.
- Grater, R.K., 1945, Landslide in Zion Canyon, Zion National Park, Utah: The Journal of Geology, v. 53, p. 116–124, doi: 10.1086/625254.
- Hamilton, W.L., 1976, Holocene and Pleistocene lakes in Zion National Park, Utah: Proceedings of the First Conference on Scientific Research in the National Parks, New Orleans, Louisiana, USA, p. 835–843.
- Hamilton, W.L., 2014, Ancient lakes of Zion National Park, in MacLean, J.S., Biek, R.F., and Huntoon, J.E., eds., Geology of Utah’s Far South: Utah Geological Association Publication, v. 43, p. 1–23.
- Hewitt, K., Gosse, J., and Clague, J., 2011, Rock avalanches and the pace of late Quaternary development of river valleys in the Karakoram Himalaya: GSA Bulletin, v. 123, p. 1836–1850, doi: 10.1130/B30341.1.
- Hungr, O., and Evans, S.G., 1996, Rock avalanche runout prediction using a dynamic model: Proceedings of the 7th International Symposium on Landslides, Trondheim, Norway, p. 233–238.
- Hungr, O., and Evans, S.G., 2004, Entrainment of debris in rock avalanches: An analysis of a long runout mechanism: GSA Bulletin, v. 116, p. 1240–1252, doi: 10.1130/B25362.1.
- Ivy-Ochs, S., and Kober, F., 2008, Surface exposure dating with cosmogenic nuclides: Quaternary Science Journal, v. 57, p. 197–209.
- Ivy-Ochs, S., Kerschner, H., Reuther, A., Maisch, M., Sailer, R., Schaefer, J., Kubik, P.W., Synal, H.A., and Schlüchter, C., 2006, The timing of glacier advances in the northern European Alps based on surface exposure dating with cosmogenic 10Be, 26Al, 36Cl, and 21Ne, in Siame, L.L., Bourlès, D.L., and Brown, E.T. eds., In Situ-Produced Cosmogenic Nuclides and Quantification of Geological Processes: Geological Society of America Special Paper 415, p. 43–60, doi: 10.1130/2006.2415(04).
- Jibson, R.W., Harp, E.L., Schulz, W., and Keefer, D.K., 2006, Large rock avalanches triggered by the M7.9 Denali Fault, Alaska, earthquake of 3 November 2002: Engineering Geology, v. 83, p. 144–160, doi: 10.1016/j.enggeo.2005.06.029.
- Korup, O., 2006, Rock-slope failure and the river long profile: Geology, v. 34, p. 45–48, doi: 10.1130/G21959.1.
- Korup, O., Densmore, A.L., and Schlunegger, F., 2010, The role of landslides in mountain range evolution: Geomorphology, v. 120, p. 77–90, doi: 10.1016/j.geomorph.2009.09.017.
- Lal, D., 1991, Cosmic ray labeling of erosion surfaces: In-situ nuclide production rates and erosion models: Earth and Planetary Science Letters, v. 104, p. 424–439, doi: 10.1016/0012-821X(91)90220-C.
- Lucas, A., Mangeney, A., and Ampuero, J.P., 2014, Frictional velocity-weakening in landslides on Earth and on other planetary bodies: Nature Communications, v. 5, doi: 10.1038/ncomms4417.
- Lund, W.R., Knudsen, T.R., and Sharrow, D.L., 2010, Geologic hazards of the Zion National Park geologic hazard study area, Washington and Kane Counties, Utah: Utah Geological Survey Special Study 133, 97 p.
- McDougall, S., and Hungr, O., 2004, A model for the analysis of rapid landslide motion across three-dimensional terrain: Canadian Geotechnical Journal, v. 41, p. 1084–1097, doi: 10.1139/t04-052.
- Nielsen, G., Chan, M.A., and Petersen, E.U., 2009, Diagenetic coloration facies and alteration history of the Jurassic Navajo Sandstone, Zion National Park and vicinity, southwestern Utah, in Tripp, B.T., Krahulec, K., and Jordan, J.L., eds., Geology and Geological Resources and Issues of Western Utah: Utah Geological Association Publication 38, p. 67–96.
- Pankow, K.L., Moore, J.R., Hale, J.M., Koper, K.D., Kubacki, T., Whidden, K.M., and McCarter, M.K., 2014, Massive landslide at Utah copper mine generates wealth of geophysical data: GSA Today, v. 24, p. 4–9, doi: 10.1130/GSATG191A.1.
- Reimer, P.J., and 28 others, 2013, IntCal13 and Marine13 radiocarbon age calibration curves 0–50,000 years cal BP: Radiocarbon, v. 55, p. 1869–1887, doi: 10.2458/azu_js_rc.55.16947.
- Stenner, H.D., Lund, W.R., Pearthree, P.A., and Everitt, B.L., 1999, Paleoseismologic investigations of the Hurricane fault in northwestern Arizona and southwestern Utah: Arizona Geological Survey Open-File Report 99-8 (rev. 2005), 137 p.
- Stone, J.O., 2000, Air pressure and cosmogenic isotope production: Journal of Geophysical Research, v. 105, p. 23,753–23,759, doi: 10.1029/2000JB900181.
- U.S. Geological Survey, 2014, Water-resources data for the United States, Water year 2013: U.S. Geological Survey Water-Data Report WDR-US-2013, site 09405500, 3 p.