
Full Text View
Volume 24 Issue 1 (January 2014)
GSA Today
![]()
Article, pp. 4-9 | Abstract | PDF (7.2 MB)
Massive landslide at Utah copper mine generates wealth of geophysical data
| Table of Contents |
|---|
|
Search GoogleScholar for
Search GSA Today |
ABSTRACT
On the evening of 10 April 2013 (MDT) a massive landslide occurred at the Bingham Canyon copper mine near Salt Lake City, Utah, USA. The northeastern wall of the 970-m-deep pit collapsed in two distinct episodes that were each sudden, lasting ~90 seconds, but separated in time by ~1.5 hours. In total, ~65 million cubic meters of material was deposited, making the cumulative event likely the largest non-volcanic landslide to have occurred in North America in modern times. Fortunately, there were no fatalities or injuries. Because of extensive geotechnical surveillance, mine operators were aware of the instability and had previously evacuated the area. The Bingham Canyon mine is located within a dense regional network of seismometers and infrasound sensors, making the 10 April landslide one of the best recorded in history. Seismograms show a complex mixture of short- and long-period energy that is visible throughout the network (6–400 km). Local magnitudes (ML) for the two slides, which are based on the amplitudes of short-period waves, were estimated at 2.5 and 2.4, while magnitudes based on the duration of seismic energy (md) were much larger (>3.5). This magnitude discrepancy, and in particular the relative enhancement of long-period energy, is characteristic of landslide seismic sources. Interestingly, in the six days following the landslide, 16 additional seismic events were detected and located in the mine area. Seismograms for these events have impulsive arrivals characteristic of tectonic earthquakes. Hence, it appears that in this case the common geological sequence of events was inverted: Instead of a large earthquake triggering landslides, it was a landslide that triggered several small earthquakes.
*Email:
Manuscript received 23 May 2013; accepted 8 July 2013
DOI: 10.1130/GSATG191A.1
Introduction
Landslides are among the most destructive geological forces in nature, causing billions of dollars in damage annually (see landslides.usgs.gov [USGS, 2013]). For the period of 2004–2011, more than 32,000 landslide-related fatalities have been documented, not including those landslides caused by earthquakes (Petley, 2012). Here, we describe a recent massive landslide in Utah that was successfully forecast and thus resulted in no fatalities or injuries. Furthermore, it occurred within a dense regional network of seismic and acoustic sensors, generating a valuable and unique data set for studying landslide physics.
The Bingham Canyon Landslide
The landslide occurred on 10 April 2013 at the Bingham Canyon open-pit copper mine, located in the Oquirrh Mountains ~33 km southwest of downtown Salt Lake City, Utah, USA (Fig. 1A). Leaving a massive scar on the upper half of the northern pit wall, the slide filled the mine floor with thick debris (Fig. 1B). The long runout and distinctive flow-like character of the deposit suggest that the event was a particular type of extremely rapid mass movement known as a rock avalanche (Hungr et al., 2001).
|
(A) University of Utah seismic and infrasound network, and location of the Bingham Canyon mine. (B) Photograph of the 10 April 2013 rock avalanche (copyright Kennecott Utah Copper, used with permission). Elevation of the crest and toe of the slide are shown, as well as an estimate of the runout distance along the arcuate travel path. A group of large haul trucks damaged by the slide can be seen at lower left. |
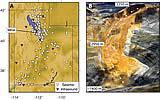 Figure 1
At more than 970 m deep, Kennecott’s Bingham Canyon mine is the largest man-made excavation in the world. It has been in operation since 1906 and produces 25% of the copper used in the United States. The site has produced more copper than any mine in history. For decades, mine operators have monitored the stability of pit slopes within the Bingham Canyon mine, operating a surveillance network that includes the latest techniques in early-warning monitoring, such as automated geodetic networks, in situ extensometers, and ground-based radar interferometry (e.g., Gischig et al., 2011). These monitoring systems proved crucial in first identifying, and then monitoring, the displacement of the incipient landslide on the northeastern wall of the Bingham Canyon mine.
Signs of increasing instability were evident throughout early 2013 as displacements accelerated within the unstable area. A visitor center, which had been located within the landslide source region, was closed and removed. Ultimately, on 10 April, movements became so strong that mine operators evacuated the area and issued a press release stating that failure was imminent and rising dust might become visible. The first rock avalanche occurred roughly seven hours later at 9:30 p.m. MDT. Because the area had been evacuated, there were no injuries; however, several pieces of heavy equipment and critical infrastructure were damaged or impacted. These included 14 haul trucks, three shovels, and the forced closure of the pit’s main access ramp.
Comparing digital elevation models from before and after the event, Kennecott estimated the landslide moved a total mass of 165 million tons (Kennecott Utah Copper, 2013), equivalent to a source volume of roughly 55 million cubic meters. As the source rock breaks up, it expands, typically by 10%–30%, so the deposit volume was likely in the range of 65 million cubic meters. For comparison, the deposit would cover New York City’s Central Park with ~20 m of debris. These volumes make the Bingham Canyon rock avalanche likely the largest non-volcanic landslide in North American history, eclipsing the recent 2012 Lituya Bay rock avalanche in Alaska (volume <50 million m3), the 2010 Mount Meager rock slide/debris flow in British Columbia (48 million m3), the 1965 Hope rock slide in British Columbia (47 million m3), the 1959 Madison River Canyon landslide in Montana (30 million m3), and the 1903 Frank slide in the Northwest Territories of Canada (30 million m3). In North America and worldwide, rock avalanches of this size routinely claim lives; the Madison River Canyon slide killed 28, the Frank slide killed up to 90, while the 2009 Xiaolin landslide in Taiwan (25 million m3) caused nearly 500 fatalities. These statistics highlight the potentially devastating consequences of catastrophic rock avalanches and emphasize the importance of early-warning monitoring systems, such as those used at the Bingham Canyon mine.
Rock avalanches are distinguished from other types of landslides by their massive volume and characteristically fast and long runout. While rock fall debris, for example, accumulates at steep inclinations close to the angle of repose, rock avalanche deposits can spread over many kilometers, leaving gently inclined, characteristically hummocky terrain containing highly crushed and fragmented, yet compact, debris. Typical flow velocities are in the range of tens of meters per second and can reach as high as 100 m/s (e.g., Crosta et al., 2004). In the past, such runout was often thought to be anomalous, but today we know it is common for source volumes of this size that fail in a catastrophic manner, although the precise mechanisms driving rock avalanche dynamics are still debated (Davies and McSaveney, 2012). Comparing the geometry (fall height and length) of the Bingham Canyon rock avalanche with other events from across the globe shows that, at roughly 2950 m, the total travel distance from crest to toe is within the expected range for events of this size (Fig. 2). The slide would likely have run farther had it not impacted the southern pit wall. Considerable variability exists within the global data set, however, and precise prediction of runout distance, even with the aid of numerical modeling, is challenging.
|
Comparison of the Bingham Canyon rock avalanche (red dot) with other reported landslide events from across the globe (figure modified from Bourrier et al., 2013, with data from C. Davidson, unpublished M.Eng. thesis, 2011). The estimated geometry results in a Fahrboeschung value (defined as the angle α relating the fall height and length) of 16°, which is within the expected range for events of this size. |
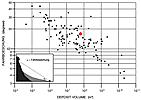 Figure 2
Local news agencies reported initial cost estimates related to the Bingham Canyon rock avalanche approaching one billion dollars. If these estimates prove correct, the rock avalanche will become the most expensive landslide in U.S. history, surpassing the 1983 Thistle slide (also in Utah), which at the time was estimated to have cost between 460 and 940 million dollars (values adjusted for inflation). For now, the successful monitoring and hazard mitigation are heralded as an achievement, as well as an example to others facing the danger of catastrophic rock slope failures.
Seismic and Infrasound Recordings of the Landslide
The University of Utah Seismograph Stations (UUSS) has operated a seismic network in the Utah region (Fig. 1A) since the early 1960s (Pechmann et al., 2007; Thomas et al., 2013) with the goal of detecting, locating, and characterizing regional earthquakes associated with the Intermountain Seismic Belt (Smith and Arabasz, 1991). The network is a Tier I component of the Advanced National Seismic System (ANSS) of the U.S. Geological Survey (USGS, 1999) and is funded via a state-federal partnership. As of 1 April 2013, the Utah network consisted of 200 seismographs, including broadband, accelerometer, and short-period sensors, generating 667 channels of 100 Hz seismic data, which are telemetered in near–real-time to the UUSS operations center and archived at the public data center of the Incorporated Research Institutions for Seismology (IRIS, see www.iris.edu). Station density is greater along the Wasatch Front, an area of high seismic hazard. In addition to the seismic network, UUSS operates nine infrasound arrays throughout the state in collaboration with Southern Methodist University and Los Alamos National Laboratory (Hale et al., 2010).
Seismic signals from the Bingham Canyon landslide were recorded by UUSS at distances ranging from ~6 to over 400 km, while infrasound signals were recorded at seven arrays at distances from 13 to 400 km. Inspection of the seismic data importantly revealed that the landslide consisted of two distinct rock avalanche events separated by ~1.5 h. Raw seismograms for the two rock avalanches appear similar and are dominated by persistent, long-period (>10 s) energy; however, isolation of the long-period signals reveals significant differences (Fig. 3). For example, low-passed data from the first rock avalanche show a high-amplitude peak near the end of the coda, a feature that the second event lacks; meanwhile, the timing of the two maxima differs by tens of seconds.
|
(A) Seismic and acoustic waveforms recorded at NOQ (13 km from slide), the closest broadband seismic station. Seismic traces are vertical component-velocity in different frequency bands (broadband, high-passed at 1 Hz, low-passed at 0.1 Hz); acoustic traces are infrasonic beams steered toward the mine in a pass band of 0.5–5.0 Hz. Gray box indicates time period with coherent signal originating from the mine. Amplitude scales are consistent for each pass band (i.e., they are consistent across each row). (B) Same as in (A) for seismic and acoustic waveforms recorded at station WMUT (57 km from the slide). Seismic traces were recorded by a short-period vertical-component seismometer. |
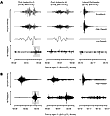 Figure 3
Inspection of the infrasound data confirms that there were two distinct rock avalanche events. Figure 3 shows beams formed by steering the arrays at two stations, NOQ and WMUT, toward the mine. For the first rock avalanche, there is a coherent signal on both arrays, arriving at times consistent with the slide as the source. However, at NOQ (13 km from the mine) the energy consists primarily of a sharp impulse, while at WMUT (57 km from the mine) the energy is >30 s in duration with both a long onset and coda. Differences in the waveforms likely result from different atmospheric travel paths. For the second rock avalanche, array processing shows no coherent signal at NOQ coming from the mine, while the coherent signal at WMUT is short in duration and only slightly visible above background noise. Infrasound data from the second event are more difficult to discern because of increased background noise, possibly due to local winds (there was a rainstorm the night of the landslide).
We can use the seismic observations to generate first-order estimates of the relative volumes of the two rock avalanches. Comparing signal durations, peak amplitudes of the seismogram envelopes, and area underneath each envelope (as in Dammeier et al., 2011), we find that the two slides were roughly equal in volume; this would correspondingly split and move the data point presented in Figure 2. We note, however, that photographs suggest that the second rock avalanche likely contained a greater proportion of waste-rock deposited on the slope during previous mining and so may have had a lower bulk density than the first failure. Photographs also show that the first rock avalanche filled the entire pit floor, while the second apparently stopped short of the southern wall, suggesting the first slide may have been slightly larger.
The ultra-emergent nature of seismic signals from the rock avalanches made standard earthquake detection algorithms employed by UUSS ineffective. Such power detectors rely on short-term versus long-term averages and are tuned to alarm on impulsive P waves. However, the two rock avalanches were automatically detected and located using an algorithm based on the continuous back propagation of globally recorded long-period surface waves (Ekström, 2006), which has previously been successful in detecting large landslides (Ekström and Stark, 2013). The detection amplitudes correspond to surface-wave magnitudes (Ms) of 5.1 and 4.9 for the first and second events, respectively (G. Ekström, personal commun., 2013).
With no clear P-wave arrivals, UUSS determined the location for the two rock avalanches at 40.536°N 112.142°W using satellite images. Origin times of 03:30:22 and 05:05:22 on 11 April 2013 (UTC) were estimated by subtracting 1 s from the arrival time of the initial seismic energy at nearby stations (CFS, 6 km away; MID, 8 km away). Given the unknown phase of the first arrivals, we are unable to calculate a more precise time. Using the estimated location, local (ML) and duration (md, also known as Mc or coda magnitude) magnitudes for the first rock avalanche were calculated to be 2.5 and 4.2, respectively. For the second rock avalanche, the magnitudes were 2.4 and 3.5, respectively. Raw waveforms for each slide show two successive packets of energy with approximately equal peak amplitudes (Fig. 3A). For the first rock avalanche, the trailing packet is dominated by low-frequency energy, while for the second event it is rich in high-frequency energy. This secondary pulse of high-frequency energy for the second slide results in waveforms that differ from the typical coda decay seen in earthquakes or in the first rock avalanche (Fig. 3B) and makes comparison of duration magnitudes between the two events difficult. The md 3.5 for the second rock avalanche should thus be considered a lower bound.
The two UUSS magnitudes scales are designed to overlap seamlessly. For the 6,664 earthquakes that occurred in the Utah region during 2000–2011 and were large enough for ML to be estimated, the mean ML–md difference is only −0.12 with a standard deviation of 0.30. Therefore, the large ML–md values observed for the two rock avalanches (−1.7 and <−1.1) are indicative of non-earthquake seismic sources, and are consistent with enhanced ratios of long-period to short-period energy relative to earthquakes (cf. Fig. 3). This, in turn, is consistent with previous seismic observations of landslides showing large Ms–mb differences compared to earthquakes (Weichert et al., 1994).
There were no obvious seismic or acoustic signals preceding the first rock avalanche. However, immediately following the second slide, an ML 2.5 (md 3.0) earthquake, plus three smaller quakes, occurred at shallow depths (<2 km) beneath the mine. All four of these events were automatically detected and located using normal UUSS procedures. The events have short impulsive waveforms (Fig. 3) that are characteristic of tectonic earthquakes and unlike the rock avalanche waveforms. Cross-correlation analyses using the ML 2.5 event and the three smaller quakes as templates (Kubacki et al., 2013) suggest the existence of twelve additional earthquakes, with magnitudes ranging from ML −0.8 to 0.5. Six occurred between the two rock avalanches, five occurred in the two days following the second rock avalanche, and one occurred ten days later on April 20 (Fig. 4). There were no earthquakes detected in the ten days preceding the first slide. The coincidence between the timing of these tectonic events and the landslide suggests the tectonic events are triggered aftershocks of the rock avalanches. Other shallow, non-earthquake seismic sources, such as mine collapses (Pechmann et al., 2008) and nuclear explosions (Ford and Walter, 2010), have been known to generate aftershock sequences. The causative nature of aftershock triggering at the Bingham Canyon mine can be confirmed by detailed analysis of previous seismicity in the area, which will be pursued in a future study.
|
Time period of cross-correlation template analysis. Earthquake activity began shortly after the first rock avalanche and ceased 10 days later. |
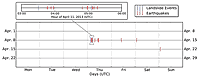 Figure 4
Future Research Directions
Initial observations of the Bingham Canyon landslide presented here indicate a complex sequence of events consisting of two large rock avalanches and sixteen smaller, possibly triggered, earthquakes. Clearly, much work remains in order to understand the details of this sequence. Important research questions include
- How is the geometry of the rock avalanches reflected in the geophysical data?
- Do the seismic and infrasound signals have a common source?
- Are differences in the seismic and infrasound signals of the two rock avalanches related to different physical properties of the mass flows?
- Can the long-period seismic radiation be well fit by an equivalent-force model dominated by a single force, or is a more complex source model required?
- How are the 16 small seismic events (~−0.8–3.0 md) that occurred in the mine area in the ten days following the landslide related to the two rock avalanches?
Acknowledgments
This work was partially supported by the State of Utah under a line-item appropriation to the University of Utah Seismograph Stations (UUSS) and by the U.S. Geological Survey, Department of the Interior, under USGS award number G10AC00085. We thank Kennecott Utah Copper for providing the photograph used in Figure 1. Figures 1A, 3, and 4 were drawn using the Generic Mapping Tools (http://gmt.soest.hawaii.edu/; Wessel and Smith, 1998).
References Cited
- Bourrier, F., Dorren, L., and Hungr, O., 2013, The use of ballistic trajectory and granular flow models in predicting rockfall propagation: Earth Surface Processes and Landforms, v. 38, p. 435–440, doi: 10.1002/esp.3372.
- Crosta, G.B., Chen, H., and Lee, C.F., 2004, Replay of the 1987 Val Pola landslide, Italian Alps: Geomorphology, v. 60, p. 127–146, doi: 10.1016/j.geomorph.2003.07.015.
- Dammeier, F., Moore, J.R., Haslinger, F., and Loew, S., 2011, Characterization of alpine rockslides using statistical analysis of seismic signals: Journal of Geophysical Research, v. 116, F04024, doi: 10.1029/2011JF002037.
- Davidson, C., 2011, Rock avalanches [unpublished M.Eng. thesis]: Vancouver, University of British Columbia, 13 p.
- Davies, T., and McSaveney, M., 2012, Mobility of long-runout rock avalanches, in Clague, J.J., and Stead, D., eds., Landslides: Types, Mechanisms and Modeling: New York, Cambridge University Press, p. 50–58.
- Ekström, G., 2006, Global detection and location of seismic sources by using surface waves: Bulletin of the Seismological Society of America, v. 96, p. 1201–1212, doi: 10.1785/0120050175.
- Ekström, G., and Stark, C.P., 2013, Simple scaling of catastrophic landslide dynamics: Science, v. 339, p. 1416–1419, doi: 10.1126/science.1232887.
- Ford, S.R., and Walter, W.R., 2010, Aftershock characteristics as a means of discriminating explosions from earthquakes: Bulletin of the Seismological Society of America, v. 100, no. 1, p. 364–376, doi: 10.1785/0120080349.
- Gischig, V., Amann, F., Moore, J.R., Loew, S., Eisenbeiss, H., and Stempfhuber, W., 2011, Composite rock slope kinematics at the current Randa instability, Switzerland, based on remote sensing and numerical modeling: Engineering Geology, v. 118, no. 1–2, p. 37–53, doi: 10.1016/j.enggeo.2010.11.006.
- Hale, J., Arrowsmith, S., Hayward, C., Burlacu, R., Pankow, K., Stump, B., Randall, G., and Taylor, S., 2010, Infrasound Signal Characteristics from Small Earthquakes, in Proceedings of 2010 Monitoring Research Review: Ground-Based Nuclear Explosion Monitoring Technologies, LA-UR-10-05578, p. 720–730.
- Hungr, O., Evans, S.G., Bovis, M.J., and Hutchinson, J.N., 2001, A review of the classification of landslides of the flow type: Environmental & Engineering Geoscience, v. 7, no. 3, p. 221–238.
- Kennecott Utah Copper, 2013, Early estimates of slide impacts released, Newsroom, April 16, 2013: http://www.kennecott.com/slideupdates/early-estimates-slide-impacts-released (last accessed June 2013).
- Kubacki, T.M., Koper, K.D., Pankow, K.L., and McCarter, M.K., 2013, Cross-correlation detection of seismic events related to the Crandall Canyon Mine collapse: Morgantown, West Virginia, USA, in Proceedings of the 32nd International Conference on Ground Control Mining, 30 July–1 Aug. 2013, 6 p., http://icgcm.conferenceacademy.com/papers/detail.aspx?iid=1380 (last accessed 11 Oct. 2013).
- Pechmann, J.C., Nava, S.J., Terra, F.M., and Bernier, J.C., 2007, Local magnitude determinations for intermountain seismic belt earthquakes from broadband digital data: Bulletin of the Seismological Society of America, v. 97, p. 557–574, doi: 10.1785/0120060114.
- Pechmann, J.C., Arabasz, W.J., Pankow, K.L., Burlacu, R., and McCarter, M.K., 2008, Seismological report on the 6 August 2007 Crandall Canyon Mine collapse in Utah: Seismological Research Letters, v. 79, no. 5, p. 620–636, doi: 10.1785/gssrl.79.5.620.
- Petley, D., 2012, Global patterns of loss of life from landslides: Geology, v. 40, no. 10, p. 927–930, doi: 10.1130/G33217.1.
- Smith, R.B., and Arabasz, W.J., 1991, Seismicity of the Intermountain Seismic Belt, in Slemmons, D.B., Engdahl E.R., Zoback, M.D., and Blackwell, D.D., eds., Neotectonics of North America: Geological Society of America Decade of North American Geology, Map 1, scale: 1:5,000,000, p. 185–228.
- Thomas, G., Koper, K.D., Burlacu, R., and Drobeck, D., 2013, A model of ambient seismic noise recorded by the Utah regional network of strong-motion seismometers: Seismological Research Letters, v. 84, p. 759–771, doi: 10.1785/0220130026.
- USGS, 1999, An Assessment of Seismic Monitoring in the United States: Requirements for an Advanced National Seismic System: U.S. Geological Survey Circular, 1188, p. 1–55.
- USGS, 2013, Landslide hazards program: U.S. Geological Survey, http://landslides.usgs.gov/ (last accessed 11 Oct. 2013).
- Weichert, D., Horner, R.B., and Evans, S.G., 1994, Seismic signatures of landslides: The 1990 Brenda Mine Collapse and the 1965 Hope Rockslides: Bulletin of the Seismological Society of America, v. 84, p. 1523–1532.
- Wessel, P., and Smith, W.H.F., 1998, New, improved version of Generic Mapping Tools released: Eos (Transactions, American Geophysical Union), v. 79, p. 579, doi: 10.1029/98EO00426.