
Full Text View
Volume 22 Issue 10 (October 2012)
GSA Today
![]()
Article, pp. 42–44 | Abstract | PDF (191KB)
 |
| Table of Contents |
|---|
| Search GoogleScholar for Search GSA Today |
GROUNDWORK:
Rebuilding Tohoku: A joint geophysical and economic framework for hazard mitigation
1 Applied Mathematics, Brown University, Providence, Rhode Island 02912, USA
2 Earth and Planetary Sciences, Northwestern University, Evanston, Illinois 60208, USA
Japanese authorities face complex issues in reconstructing the Tohoku coast that suffered enormous damage from the tsunami generated by the M9.0 earthquake on 11 March 2011. The tsunami overtopped coastal defenses, primarily 5–10 m seawalls, causing more than 15,000 deaths and US$210 billion damage (Normile, 2012) (Fig. 1). If and how such defenses should be rebuilt is a challenging question. Here, we outline a framework to find the optimal level of mitigation by balancing its cost against the expected damages. This framework can be applied to exploring policies under various hazard scenarios and mitigating other natural hazards.
* Email:
Manuscript received 27 March 2012; accepted 30 May 2012.
doi: 10.1130/GSATG154GW.1
|
More than a dozen ships were washed inland by the 11 March 2011 Tohoku tsunami in Kesennuma City, Myagi Prefecture. This massive fishing trawler, the no. 18 Kyotoku-maru ship, came to rest on top of a giant debris pile on one of the main roads to City Hall. Photo by Hermann M. Fritz, 16 April 2011. See Fritz et al., 2012, for more about the tsunami’s effects. |
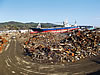 Figure 1
Because defenses to withstand tsunamis as large as that of March 2011 are too expensive, those planned are about 12 m high, only a few meters higher than before March (Cyranoski, 2012a). These seawalls should protect against the largest tsunamis expected every 200–300 years, augmented with land-use planning and warning and evacuation procedures to protect against larger tsunamis. The defenses should reduce economic losses, while improved warning and evacuations should reduce fatalities, as shown by the March experience (Ando et al., 2011). However, critics argue that in areas with small and decreasing populations it would be more efficient to relocate communities. Otherwise, “In 30 years there might be nothing here but fancy breakwaters and empty houses” (Onishi, 2011).
A similar issue arises along the Nankai Trough to the south, where new estimates warning of tsunamis 2–5 times higher than in previous models raise the question of what to do, given that the timescale on which such events may occur is unknown (Cyranoski, 2012b). In the words of economist H. Hori (personal commun., 2012), “What should we do in face of uncertainty? Some say we should spend our resources on present problems instead of wasting them on things whose results are uncertain. Others say we should prepare for future unknown disasters precisely because they are uncertain.”
This situation illustrates the common need to decide how much natural hazard mitigation is appropriate. More mitigation can reduce losses in possible future disasters, but at increased cost. Less mitigation reduces costs, but can increase potential losses. Typically, these decisions are made politically, without explicitly considering the tradeoff between costs and benefits. We thus propose a simple model that minimizes the sum of the expected property losses from tsunamis and the cost of mitigation, which can be generalized to other hazard policy situations.
At some point on the coast, we denote the cost of mitigation as C(n), where n is the height of a seawall, which we use as our example, or a measure of mitigation in another method that increases resilience (Ewing and Synolokis, 2010), such as the width of a no-construction zone. For a tsunami of height h, the predicted economic loss (L) is L(h − n), where h − n is the height to which a tsunami will overtop a seawall or otherwise exceed a design parameter. L(h − n) is ideally zero for a tsunami smaller than the design value n and increases for larger tsunamis. L includes both damage and indirect economic losses, like those resulting from the destruction of the Fukushima power plant. The probability (p) of an overtop of height h − n is p(h − n),so the expected loss (E)over the life of the wall is
Q(n) = E{L(n)} = Sh p(h − n)L(h − n), (Equation 1)
the sum of losses from tsunamis of different heights weighted by their probabilities: p(h − n) describes the hazard, the occurrence of tsunamis of a certain size, and Q(n)reflects the risk, the present value of the expected loss, which depends on the mitigation level n. The expected loss increases less rapidly with tsunami height than the loss itself for the largest events, because these events are rarer.
The optimum level of mitigation, n*,minimizes the total cost K, the sum of the expected loss, and mitigation cost C,
K(n*) = minn [Q(n) + C(n)]. (Equation 2)
K(n) illustrates the tradeoff between mitigation and damage because it has a minimum at the optimum mitigation level (Fig. 2A). More mitigation gives less expected damage but higher total cost, whereas less mitigation decreases construction costs but increases the expected damage and thus total cost.
|
(A) The optimal mitigation level, n*, minimizes the total cost, the sum of expected loss and mitigation cost. (B) n* occurs when the reduced loss −Q′(n) equals the incremental mitigation cost C′(n). Including the effect of uncertainty and risk aversion, the optimal wall height n** occurs when the incremental cost equals the sum of the reduced loss and incremental decline in the risk term R′(n). |
 Figure 2
How this works is shown by the derivatives of the functions (Fig. 2B). The total cost is minimum where C′(n*) = −Q′(n*). Because increasingly high levels of mitigation are more costly, the marginal cost C′(n) increases with wall height. Conversely, −Q′(n), the reduced loss from a small height increment, decreases. The lines intersect at n*, the highest level to which it pays to build the wall. If they intersect where n* is positive, building a wall pays. However, even if when the wall height is zero its incremental cost C′(0) is greater than the incremental loss reduction−Q′(0), building a wall does not pay.
Because the expected loss Q(n) and mitigation cost C(n) vary along the coast, the optimal mitigation level also varies. For sparsely populated areas, n* shifts leftward, implying less mitigation. Where expected losses are greater, such as urban areas or critical facilities, n* shifts rightward, justifying higher mitigation.
This approach requires estimating the probability of a tsunami of a certain height and the effectiveness of the defenses, which are often less than planned (Yalciner et al., 2011). The fact that the March 2011 tsunami was much greater than predicted based on the Japanese earthquake hazard map (Geller, 2012) shows that models that predict future occurrences of these events have large uncertainties (Stein et al., 2011).
Improvements should be forthcoming (Kanamori, 2012) from more effective use of earthquake history information (McCaffrey, 2007; Stein and Okal, 2011), the paleotsunami record (Minoura et al., 2011), tsunami modeling (González et al., 2009), geodesy (Newman, 2011), and other technologies. However, predictions will still have large uncertainties. In particular, probability estimates are limited by both the length and completeness of the historic record and the fact that different models can be fit to it (Stein and Newman, 2004).
K(n) reflects the mean value of the expected loss but does not include the variance due to its uncertainty. In addition, we are risk averse in hazard mitigation. Risk aversion can be visualized using a game in which the probability of winning or losing a sum is the same, but we place greater weight on avoiding losing than on winning. Risk aversion is the ratio of the gain to the loss necessary to induce the player to bet, which is greater than one.
The combined effects of uncertainty and risk aversion can be included by adding a risk term (Stein, 2012) R(n) to the loss term Q(n). R(n) is the product of the risk aversion and the variance of the estimated loss as a function of n. Because the wall height should be increased as long as −[Q′(n) + R′(n)] exceeds the incremental cost of the wall C′(n), the optimum height increases from n* to n**.
Conceptually, society is playinga game against nature “of which we still don’t know all the rules” (Lomnitz, 1989). Nature chooses tsunami heights, and society selects the strategy to minimize the total costs of tsunami losses plus mitigation costs. As in any game of chance, we maximize our expectation value by selecting the best strategy, given our limited ability to estimate the occurrence and effects of future tsunamis. Our framework makes it possible to explore the expected benefits for alternative models of the hazard.
Similar situations arise for other natural hazards, including earthquake ground shaking, river flooding, and hurricanes. The optimal level of mitigation minimizes the total of losses and mitigation costs and depends on the assumed hazard model. Our formulation can thus be used to explore policies under alternative scenarios—for example, scenarios in which the probability of large earthquakes is either constant with time since the previous one or small at first and increases with time (Stein and Hebden, 2009). It can also be used to explore policies for scenarios in which global warming increases the effects of hurricanes (Emanuel, 2011).
Ultimately, decisions on natural hazard mitigation policy are made through a political process reflecting non-economic factors. Nonetheless, input from combined geophysical and economic analysis can improve the decision making.
References Cited
- Ando, M., Ishida, M., Hayashi, Y., and Mizuki, C., 2011, Interviews with survivors of Tohoku earthquake provide insights into fatality rate: Eos (Transactions of the American Geophysical Union) v. 46, p. 411.
- Cyranoski, D., 2012a, Rebuilding Japan: Nature, v. 483, p. 141–143.
- Cyranoski, D., 2012b, Tsunami simulations scare Japan: Nature, v. 484, p. 296–297.
- Emanuel, K., 2011, Global warming effects on U.S. hurricane damage: Weather, Climate, Society, v. 3, p. 261–268.
- Ewing, L., and Synolakis, C., 2010, Community resilience: Proceedings of the International Conference on Coastal Engineering, v. 32, p. 1–13.
- Fritz, H.M., Phillips, D.A., Okayasu, A., Shimozono, T., Liu, H., Mohammed, F., Skanavis, V., Synolakis, C.E., and Takahashi, T., 2012, The 2011 Japan tsunami current velocity measurements from survivor videos at Kesennuma Bay using LiDAR: Geophysical Research Letters, v. 39, L00G23, doi: 10.1029/2011GL050686.
- Geller, R., 2011, Shake-up for Japanese seismology: Nature, v. 472, p. 407–409.
- González, F.I. Geist, E.L., Jaffe, B., Kânoğlu, U., Mofjeld, H., Synolakis, C.E., Titov, V.V., Arcas, D., Bellomo, D., Carlton, D., Horning, T., Johnson, J., Newman, J., Parsons, T., Peters, R., Peterson, C., Priest, G., Venturato, A., Weber, J., Wong, F., and Yalciner, A., 2009, Probabilistic tsunami hazard assessment at Seaside, Oregon: Journal of Geophysical Research, v. 114, doi: 10.1029/2008JC005132.
- Kanamori, H., 2012, Putting seismic research to effective use: Nature, v. 483, p. 147–148.
- Lomnitz, C., 1989, Comment on Temporal and magnitude dependence in earthquake recurrence models: Bulletin of the Seismological Society of America, v. 79, p. 1662.
- McCaffrey, R., 2007, The next great earthquake: Science, v. 315, p. 1675–1676.
- Minoura, K., Imamura, F., Sugawara, D., Kono, Y., and Iwashita, T., 2001, The 869 Jogan tsunami deposit and recurrence of large-scale tsunami on the coast of Northeast Japan: Journal of Natural Disaster Science, v. 23, p. 83–88.
- Newman, A.V., 2011, Hidden depths: Nature, v. 474, p. 441–443.
- Normile, D., 2012, One year after the devastation, Tohoku designs renewal: Science, v. 335, p. 1164–1166.
- Onishi, N., 2011, Japan Revives a Sea Barrier That Failed to Hold: New York Times, 2 Nov. 2011, http://www.nytimes.com/2011/11/03/world/asia/japan-revives-a-sea-barrier-that-failed-to-hold.html?_r=1 (last accessed 27 June 2012).
- Stein, J., 2012, Stochastic Optimal Control and the U.S. Financial Debt Crisis: New York, Springer, 157 p.
- Stein, S., and Hebden, J., 2009, Time-dependent seismic hazard maps for the New Madrid seismic zone and Charleston, South Carolina areas: Seismic Research Letters, v. 80, p. 12–20.
- Stein, S., and Newman, A., 2004, Characteristic and uncharacteristic earthquakes as possible artifacts: Seismic Research Letters, v. 75, p. 173–187.
- Stein, S., and Okal, E., 2011, The size of the 2011 Tohoku earthquake neednt have been a surprise: Eos (Transactions of the American Geophysical Union), v. 92, p. 227–228.
- Stein, S., Geller, R., and Liu, M., 2011, Bad assumptions or bad luck: Why earthquake hazard maps need objective testing: Seismic Research Letters, v. 82, p. 623–626.
- Yalciner, A., Suppasri, A., Mas, E., Kalligeris, N., Necmioglu, O., Imamura, F., Ozer, C., Zaytsev, A., Synolakis, C., Takahashi, S., Tomita, T., and Yon, G., 2011, Field survey on the impacts of 2011 Japan tsunami, American Geophysical Union, Fall Meeting 2011, abstract #NH11A-1360.