A New Tool for Producing 3D Orientation Symbology for Google Earth
Steven Whitmeyer and Mladen Dordevic
In this article
Authors
Steven Whitmeyer
James Madison University, Harrisonburg, Virginia 22807, USA, whitmesj@jmu.edu
Mladen Dordevic
IRIS, 1200 New York Ave. NW #400, Washington, D.C. 20005, USA
Modern methods for creating geologic maps feature a digital workflow, with dedicated mapping apps for mobile devices (e.g., ArcGIS Collector, FieldMove, StraboSpot), cloud storage of data in public repositories (e.g., strabospot.org), and preparation and presentation of maps and other deliverable products via geographic information systems (GIS), such as ArcGIS, QGIS, and Google Earth. Recently, the StraboSpot field data system (Walker et al., 2019) has provided a new standard for digital data collection and curation, and the StraboSpot app is increasingly used to collect field data. Data archived at strabospot.org can be downloaded in a variety of formats, including GIS shapefiles, KMZ files, XLS files, and image JPEGs. Mapping platforms, such as ArcGIS, FieldMove, and StraboSpot, can export field data in a variety of formats, including KMZ files that can be displayed in virtual 3D terrains. Viewing field data in a virtual 3D terrain can aid in the interpretation of planar and linear features, such as lithologic contacts, faults, and fold axes. However, field data points with orientation measurements are often not satisfactorily rendered when draped or positioned over a 3D surface that has notable topographic relief. Preferable is the depiction of orientation data as symbols in the correct 3D orientation at the virtual location equivalent to where it was mapped in the field. The depiction of 3D orientation symbols for bedding, foliation, lineation, etc. (Fig. 1), can now be easily achieved with a web-based tool called Symbols.
Figure 1
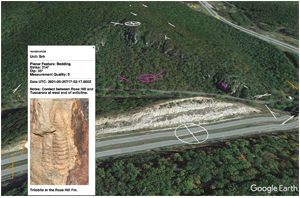
Oblique view in Google Earth of a hillside with 3D orientation symbols that document an anticlinal structure near Baker, West Virginia, USA. Orientation symbols depicted above the terrain were generated by StraboSpot for Symbols. Outcrop data and photos for a field location can be viewed by clicking a symbol, as shown in the rectangle at the left side of the figure.
Our initial version of Symbols uploads generic CSV files of field data to produce 3D orientation symbols as a KML file for Google Earth (Whitmeyer and Dordevic, 2020). Recently, in order to interface more seamlessly with the StraboSpot field mapping system, we developed a new version: Symbols2 (https://educ.jmu.edu/~whitmesj/GEODE/symbols2/), which uploads an XLS file of field data. XLS files produced by the StraboSpot app or other sources will often include more columns of data than are necessary for creating 3D orientation symbols. Data columns that are relevant for generating orientation symbols include: Latitude and Longitude (to position a symbol in the correct virtual location in Google Earth), Strike, Dip, Planar Feature Type, Facing (upright or overturned), Trend, Plunge, Linear Feature Type, Name (for a field data point), Date (when the field data was collected) and Notes (field notes as recorded by the geologist). Symbols2 can handle an XLS file of field data from any source by assigning column headers to the type of data in the column. Field data is included within pop-up balloons in Google Earth, which are displayed by clicking on a symbol (Fig. 1).
StraboSpot records lithologic units for field data points as Tags, and thus a StraboSpot XLS file will include several columns with headers as Tag:unit name. Symbols2 assigns a nominal color to each of these unit Tags, so that the orientation symbols generated will be color coded. The user can change a unit Tag color using a graphical color selector or color hex code. If preferred, a user can select a master color for all unit Tags. Other adjustable parameters for the orientation symbols include Symbol length (size of the symbols), Symbol height (height of the symbols above the Google Earth ground surface or the specified Altitude), Symbol line thickness (thickness of the symbol lines), and the Filename for the KML file that the Symbols2 tool exports. Users can group data symbols in KML folders by Unit/Formation and/or by field Location (useful if some field locations have both planar and linear data recorded). A detailed instructions file is available via a button at the upper right side of the Symbols webpage and is included as a supplement to this manuscript1.
-------
1 Supplemental Material. Detailed instructions. Go to https://doi.org/10.1130/GSAT.S.21689390 to access the supplemental material; contact editing@geosociety.org with any questions.
A consideration for creating 3D symbology for Google Earth is the height (or altitude) of the symbols relative to the Google Earth ground surface. Symbols for StraboSpot defaults to positioning orientation symbols “relative to ground” at a height above the ground surface defined by the “symbol height” setting. This works well for areas with flat terrain. However, if symbols are plotted “relative to ground” in mountainous terrain, the symbols can look distorted. StraboSpot and other mapping apps can assign an elevation to point locations if the GPS tool in the mobile device is used to collect location information. Symbols2 includes an option to use elevation information in an XLS “Altitude” column, so that the orientation symbol is positioned at the “Absolute” elevation (instead of “relative to ground”) plus the “symbol height” setting. If an altitude cell is blank, the orientation symbol is plotted “relative to ground.” Lines and polygons are plotted “clamped to ground.”
One consideration is that elevations collected by GPS receivers in mobile devices rarely match the elevation for a latitude and longitude location in the Google Earth digital elevation model (DEM). One way to correct for this discrepancy is to query Google Earth to find the DEM elevation for a specific latitude and longitude. You can do this by going to a desired location in Google Earth and reading the “elev” data from the bottom right corner of the window to update your XLS file with the altitude data for the location. This can be time consuming if you have many locations to query. Alternatively, you can automate the process in Symbols2 if you have a Google Maps API key. If “use altitude column” is selected, the user also has the option of entering their personal Google Maps API key in a field that appears below the “use altitude column” button. If a valid API key is entered, elevation data from the Google Maps DEM will be used for all points that have latitude and longitude information.
Once all parameters have been set in Symbols2 for an uploaded XLS file, a KML file with orientation symbols is generated by clicking the export button below the Tag Colors. It often takes several iterations of adjusting parameters and then evaluating the exported KML files in Google Earth to determine the preferred settings for a data set. Other outcrop information, such as field photos, can be added to the orientation symbols and placemarks in Google Earth. Images taken with the StraboSpot app can be downloaded from strabospot.org and have file names that indicate the name of the spot where the photo was taken. Photos and other imagery can be added to the pop-up balloon for a symbol in Google Earth Pro by editing the symbol placemark and adding the following text snippet to the description field:
<br><br><img src = “URL for your image” width = “400”></img><br>
Imagery added in Google Earth Pro will appear when the symbol is clicked in any version of Google Earth. However, images that are uploaded in the web version of Google Earth are stored differently and will not appear correctly in Google Earth Pro.
Once field data is represented in Google Earth by using the Symbols tools, it is fairly easy to create a digital geologic map using Google Earth’s line and polygon tools. Both the web and desktop versions of Google Earth allow users to save draft/working geologic maps as KML files. Final versions of geologic maps can be exported from Google Earth Pro using the Save Image option from the file dropdown menu and from web Google Earth via a snapshot of the Google Earth window. A short guide for creating geologic maps in Google Earth is online at https://educ.jmu.edu/~whitmesj/GEODE/Creating_GE_Geologic_Maps.pdf, and an example of a virtual field mapping exercise that uses this workflow can be found at https://serc.carleton.edu/NAGTWorkshops/online_field/activities/237160.html.
We encourage readers to explore this new and easy-to-use option for displaying 3D orientation data in Google Earth, and we welcome feedback and suggestions from users for improvements to the Symbols tools.
References
- Walker, J.D., Tikoff, B., Newman, J., Clark, R., Ash, J., Good, J., Bunse, E.G., Moller, A., Kahn, M., Williams, R.T., Michels, Z., Andrew, J.E., and Rufledt, C., 2019, StraboSpot data system for structural geology: Geosphere, v. 15, p. 533–547, https://doi.org/10.1130/GES02039.1.
- Whitmeyer, S.J., and Dordevic, M., 2020, Creating virtual geologic mapping exercises in a changing world: Geosphere, v. 17, p. 226–243, https://doi.org/10.1130/GES02308.1.
Manuscript received 10 Oct. 2022. Revised manuscript received 11 Nov. 2022. Manuscript accepted 2 Dec. 2022. Posted 20 Dec. 2022.
https://doi.org/10.1130/GSATG553GW.1
© 2022, The Geological Society of America. CC-BY-NC.