Motivation
A geological compass is an essential tool in the geologist’s field kit. It is used in various
geosciences disciplines, including geological mapping and structural geology. The past
decade has seen the emergence of digital geological compasses through excellent smartphone
or tablet apps (e.g., FieldMove Clino, eGeoCompass, Stereonet Mobile), the reliability of
which has been demonstrated for teaching and research purposes (e.g., Novakova and Pavlis,
2019; Lundmark et al., 2020). Although these digital compasses are highly ergonomic and have
greatly improved the speed and the rate of data collection (Zobl et al., 2007; Allmendinger
et al., 2017), it is essential that undergraduate students learn how analog geological
compasses work and how to use them to characterize the orientation of given geological
structures (i.e., foliations, lineations, or a combination of both) and transcribing this
information in the right format in a notebook. What is the minimum requirement for a
geological compass? It must be equipped with a clinometer, a precision magnetometer—ideally
with a fixed circular graduation—a measuring reference trench, and a bubble level. Various
geological compasses are available on the market (e.g., Brunton, Freiberg, Topochaix brands)
with several models in different price ranges. Nevertheless, equipping large student groups
with robust, accurate, semi- to fully professional models of geological compasses still
represents a significant cost. This is why I initiated the PYC (Print Your Compass) project,
building upon the emergence of affordable digital fabrication tools such as 3D printing,
which is particularly facilitated by the development of shared workspaces such as FabLabs
and creation networks in academic institutions and/or universities (Hasiuk, 2014; de Lamotte
et al., 2020; Reynolds et al., 2020).
This paper aims to provide detailed 3D plans of compass pieces, guidelines for printing
materials, magnets and pivot system, and validating the accuracy of printed compasses. I
hope that such initiatives will allow students from their first degree to master’s level,
teachers, and geoscientists in general, to print their geological compass at a lowered cost,
adapted to their specific needs, and with sustainable manufacturing.
How to Print Your Compass
The PYC compass (v.0.94) presented in Figure 1A is designed in five modules. Part 1 is the
core of the compass, printed here using Selective Laser Sintering (SLS) in rigid Nylon
Polyamide (PA12) with a printing resolution <80 µm. The front side of Part 1 is made of a
cylindrical cavity embedding the precision compass, and the back side is marked by a
circular gully in which a 2-mm-wide brass ball will be used as a clinometer. Part 2
comprises the magnet and pivot system. It is made of a pile of three stacked pieces printed
using SLS–PA12 (Fig. 1A) in which a brass pivot and four Nd-magnets (15 mm long × 3 mm in
diameter) are enclosed. The magnet and pivot system is ultimately stacked and sealed by two
vertical nylon screws. The magnet and pivot system is balanced on a brass nail crossing Part
1 vertically. Part 3 and Part 4 are the closing windows placed on each side of the PYC
compass. They both consist of a 2-mm-thick and 80-mm-side square plexiglass window. They are
crucial parts of the compass as they display the graduations for precise measurements. Part
3 comes with inclination degrees from 0 to 90° (with a precision of 2°), and Part 4 is
graduated from 0 to 360° for azimuth measurement respective to north (with a precision of
1°). Graduations can be directly printed onto plexiglass pieces or as transparent flipped
vinyl stickers placed on their inner side. Small nylon screws are used to fix these windows
to the main part of the PYC compass. Part 5 comprises two levels and the casing of the PYC
compass. One rounded level (15 mm in diameter and 8 mm in height) can be embedded on the
front side of the PYC compass to enable levelling, along with a second cylindrical level on
the side of the PYC compass to improve finding the line of slope on a planar structure. The
protection case, printed here in a flexible resin (thermoplastic polyurethane), is designed
to laterally slide the PYC compass in it and act as a shock absorber. The whole compass is
10 × 10 × 2.3 cm in size and weighs less than 0.25 kg. It can be easily disassembled, and
each of the constitutive pieces can be replaced. The 3D models can be found in the
supplemental material1 or here: https://skfb.ly/opCJY. These are licensed under a Creative
Commons Attribution 4.0 International License (CC BY 4.0).
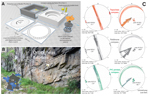 Figure 1
(A) Disassembly view of the “Print Your Compass” (PYC) 3D models. (B) Field picture showing
the outcrop on which the PYC compass was tested. The outcrop displays an augen orthogneiss
massif with foliations slightly dipping to the NNW, itself crosscut by late joints and
faulted structures. Lower left is a sketch map of the French basement in blue locating the
French Massif Central and the investigated outcrop (yellow star). (C) Two columns of
comparative Stereonet plots. The first column shows measurement of the subvertical joints
and faults, the second shows the measurement of foliations. Poles of planes are shown with
the average value as a blank square. Rose diagrams show the distribution of strikes’
azimuths. These plots were done using the Geolokit app (Triantafyllou et al., 2017).
Validating the PYC Compass Accuracy in the Field
I tested the PYC compass in the field and compared measurements against reliable compasses,
including the Topochaix Universelle compass and the FieldMove Clino app running on a Samsung
S7 smartphone. The test was conducted on the Moulin de Cezinieux orthogneissic unit located
in the northern Pilat region (eastern French Massif Central; Fig. 1B). This outcrop is made
of low-dipping metamorphic foliations from the late Hercynian orogenic collapse (e.g.,
Gardien et al., 2021). These ductile structures are crosscut by recent subvertical joints
and faults. Tests were made on these two types of structures with twenty planar measurements
for each compass: (i) Concerning foliation measurements, using the FieldMove digital
compass, the mean strike direction is N229.0 ± 6.6° (95% polar confidence), and the mean
dipping value is 22.2° to the NW. For the Topochaix Universelle compass, the mean strike
direction is N231.3 ± 5.0°, and the mean dip is at 20.9° to the NW. For the PYC printed
compass, the mean strike direction is at N232.7 ± 4.9° and the averaged dipping value was
20.7° to the NW with a radius of polar confidence at 5% of 2.35° (Fig. 1C). (ii) Concerning
the subvertical joints and faults measurements, the FieldMove digital compass provides an
averaged strike direction of N344.2 ± 2.7° and a mean dip at 87.2° to the E. For the
Topochaix Universelle compass, the mean strike direction trends to N339.6 ± 1.5°, and the
mean dipping value is 89.9° to the E. The PYC compass provides a mean strike direction at
N341.9 ± 1.7° and an averaged dipping value at 86.1° to the E (see Fig. 1C). The reliability
of the PYC compass is attested first by the small polar differences between PYC mean pole
values and those measured with the Topochaix and the FieldMove Clino app, which yields 4.4°
and 2.5°, respectively, for the foliation structures and 0.2° and 15.0°, respectively, for
the joint/faulted structures; and second by the small radius of polar confidence at 5% of
2.35°, indicating a reduced data spread and a good reproducibility during structures
measurement.
Acknowledgments
The author acknowledges support from the Université Claude Bernard de Lyon and the LGLTPE
laboratory for the grant: “Bonus Qualité Recherche–EC 2021.”
References Cited
- Allmendinger, R.W., Siron, C.R., and Scott, C.P., 2017, Structural data collection with
mobile devices: Accuracy, redundancy, and best practices: Journal of Structural Geology,
v. 102, p. 98–112, https://doi.org/10.1016/j.jsg.2017.07.011.
- de Lamotte, D.F., Leturmy, P., Souloumiac, P., and de Lamotte, A.F., 2020, Using 3D
printed models to help the understanding of geological maps: Copernicus Meetings, no.
EGU2020-8757.
- Gardien, V., Martelat, J.E., Leloup, P.H., Mahéo, G., Bevillard, B., Allemand, P., and
Fellah, C., 2021, Fast exhumation rate during late orogenic extension: The new timing of
the Pilat detachment fault (French Massif Central, Variscan belt): Gondwana Research,
https://doi.org/10.1016/j.gr.2021.10.007.
- Hasiuk, F., 2014, Making things geological: 3-D printing in the geosciences: GSA Today,
v. 24, no. 8, p. 28–29, https://doi.org/10.1130/GSATG211GW.1.
- Lundmark, A.M., Augland, L.E., and Jørgensen, S.V., 2020, Digital fieldwork with
Fieldmove—How do digital tools influence geoscience stu-dents’ learning experience in
the field?: Journal of Geography in Higher Education, v. 44, no. 3, p. 427–440,
https://doi.org/10.1080/03098265.2020.1712685.
- Novakova, L., and Pavlis, T.L., 2019, Modern methods in structural geology of
twenty-first century: Digital mapping and digital devices for the field geology, in
Mukherjee, S., ed., Teaching methodologies in structural geology and tectonics:
Singapore, Springer, p. 43–54, https://doi.org/10.1007/978-981-13-2781-0_3.
- Reynolds, M., Waldron, J.W., and Marin, L.F., 2020, 3D-printed models: Tools for
teaching 3D visualization of subsurface geology: AGU Fall Meeting Abstracts, v. 2020, p.
ED002–0001.
- Triantafyllou, A., Watlet, A., and Bastin, C., 2017, Geolokit: An interactive tool for
visualising and exploring geoscientific data in Google Earth: International Journal of
Applied Earth Observation and Geoinformation, v. 62, p. 39–46,
https://doi.org/10.1016/j.jag.2017.05.011.
- Zobl, F., Brunner, F.K., and Wieser, A., 2007, Development of a digital geological
compass: Quarterly Journal of Engineering Geology and Hy-drogeology, v. 40, no. 3, p.
301–308, https://doi.org/10.1144/1470-9236/07-008.