Introduction
G.K. Gilbert’s 1886 article, “The Inculcation of the Scientific Method by Example,” introduced the protocol of
using multiple working hypotheses when conducting geological fieldwork. Gilbert recognized the need for an
explicit statement and consideration of alternative models in order to mitigate biases that arise from human
reasoning. Humans infer causes to explain their observations about the world. Once a sufficient (or even
convenient) explanation is available, that explanation tends to be favored over others; subsequent, inconsistent
observations are frequently disregarded. This tendency is referred to as “confirmation bias,” and it is one of
many cognitive biases that affect human judgment. Gilbert’s fundamental contribution was in recognizing—nearly
100 years before the formal study of decision biases—that scientific observation was vulnerable to the same
reasoning pitfalls. In short, he realized that doing better science requires not only taking advantage of the
mind’s strengths but also supporting its weaknesses. If one accepts that the mind plays a role in both data
collection and interpretation, then it follows that knowing something about how the mind operates will result in
better science.
Cognitive science has addressed the mind’s struggle with multiple competing hypotheses and the human tendency
to filter data at both conscious and unconscious levels. One of the most effective methods developed to reduce
bias is to structure the environment of inquiry to “nudge” people toward more nuanced conclusions. For example,
a particularly powerful workflow was demonstrated within geoscience practice wherein all reasonable
interpretations are explicitly articulated prior to deciding which is the most reasonable (Bond et al., 2008;
Alcalde et al., 2017). This approach is a recent example of utilizing Gilbert’s multiple working hypothesis
methodology. But, as a community, we can move beyond the need to de-bias our approaches and develop workflows
that support nuanced data collection and model articulation. A workflow to enhance field-based geologic
practice, built from cognitive science principles and designed to support the mind, has become possible with an
unexpected ally: digital database systems.
Digital database systems are now available for field-based geology (e.g., StraboSpot; Walker et al., 2019).
Access to basic digital database systems enables researchers to record nuance-rich and contextual information
regarding individual outcrops, with the added benefit of improved data sharing with the larger community. These
systems are integral to designing new workflows that take advantage of strengths and support areas of weakness
in the human mind.
This article highlights how the simultaneous use of cognitive science principles and digital data systems allow
us to fundamentally improve field geology through the characterization and capturing of the uncertainty of both
data and models. Geologists already know that uncertainty information is useful, which is why digital systems
for seismic interpretation have worked to incorporate uncertainty judgments (Leahy and Skorstad, 2013) and why
geologists already capture this information for some features (e.g., dotted versus dashed versus solid contacts
on maps). We introduce a system for capturing uncertainty across a broad range of geological features. Then we
show how these rankings can be incorporated and used in a digital data system. Finally, we demonstrate the
utility of this approach by applying it to geological mapping in the Sage Hen Flat pluton in eastern California,
where two published maps provide different interpretations of the same geology. We show that mapping with the
explicit use of uncertainty rankings allows the community to more directly evaluate published data and models
with nuanced interpretation.
Characterizing Uncertainty
As noted by R. Allmendinger (pers. commun., 2013): “Geophysicists collect data then filter; Geologists must
filter reality, then collect data.” Considering the case of field-based geology, the filtering is both
perceptual (and likely to be unconscious) and cognitive (and therefore more likely to be conscious and
strategic). Unconscious filtering is seen, for example, in the diagrams labeled “what a geologist sees” in S.
Marshak’s physical geology textbook (Marshak, 2009), where extraneous vegetation and cover are ignored.
Experience allows experts to disembed key features and thereby visually focus attention on subtle geological
patterns (Hanawalt, 1942; Kastens and Ishikawa, 2006; Reynolds, 2012). Conscious filtering is more complex.
Geologists continuously make a series of decisions in the field: What data do I collect, where should I collect
it, and is it worth collecting? All these decisions are susceptible to bias. Thus, much of the field data in
publications is heavily filtered before being made available to peer-reviewers and readers.
What geologists call “data” or an observation is not, strictly speaking, a property of the world that is
visible to everyone. Rather, field data are the accumulated balance of evidence for a claim about a property of
the world. Although geologists might object to this characterization, the geologist authors of this article have
been convinced by our cognitive scientist colleagues that it is true. For example, consider a geologist who
wonders whether to record a measurement because that person is uncertain if a rock is fully attached to the
underlying bedrock. In such a situation, the geologist must decide based on the balance of evidence for or
against this rock’s “attachedness.” In the discipline’s current working approach, a geologist will either take
and report the measurement or not: It is a binary choice. The quality of the evidence is lost, as is all the
potentially valuable data that was overlooked because the quality was under the threshold to collect and/or
report. When we talk about data uncertainty, these are the types of issues that we are considering.
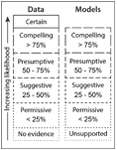
In the system we propose, there is a six-point scale to characterize uncertainty in data (recorded
observations) (Fig. 1). The scale ranges from no evidence to certain, with
four broad categories in between, from low to high: permissive, suggestive, presumptive,
compelling. These terms are chosen to reflect the judged likelihood that an observation reflects the
true state of the world (respectively, less than 25% chance, 25%–50%, 50%–75%, and greater than 75%). For data,
it is possible to be completely uncertain (no evidence) or to have such compelling evidence
that the data is essentially certain. The scale is designed to leverage humans’ strengths in
making stable judgments about mental states when using a consistent scale with a limited set of categories
(Preston and Colman, 2000).
 Figure
1
Figure
1
The uncertainty scale for geological data and models. The categories are linked to estimates of statistical
likelihood, from low to high, of
permissive (less than 25% chance),
suggestive (25%–50%),
presumptive (50%–75%),
compelling (75%–99%), and
certain (100%). Data can be
categorized as
no evidence or
certain. In contrast, it is not possible for a model to be
certain. Further, models can be
unsupported. It is possible for both data and models to be
incorrect.
Data quality is a combination of the variability in the world (e.g., local heterogeneity in a surface
orientation or diagenetic changes to minerals) and variability due to the mind (e.g., visual skill in
identifying the “representative” plane of a feature to record). The two sources of variability are inherently
intertwined, as one’s confidence in recording a feature accurately will be inversely proportional to the
observed variability of the feature in the locale. Humans can reliably estimate their relative uncertainty and
thus accuracy of decisions (Maniscalco and Lau, 2012). In present practice, some of these quality judgments are
recorded, such as in a field notebook, but not as part of the community record. Consequently, most quality
judgments are lost, including those where no data were recorded at all, as when a geologist bypasses an outcrop
looking for a better-quality one.
Models are necessarily uncertain, and the same ranking system is applicable to them (permissive,
suggestive, presumptive, compelling; Fig. 1). As an end member, models can be incorrect if
there is evidence to refute a model (e.g., flat Earth model) or unsupported if there is no data to
support a model. Likewise, no scientifically interesting models ever attain the status of certain. All
models are uncertain because they: (1) contain untested or contested assumptions; (2) have many parts for which
each part may introduce some type of uncertainty; (3) contain parts that have nonlinear effects on inferred
consequences from observations; and (4) cannot incorporate data that are yet to be obtained. Because of these
limitations, models are generally less certain than the relevant data for which they account.
Uncertainty and Bedrock Mapping
To characterize and store data uncertainty information, it is necessary to clearly specify the different
aspects of the data that could be uncertain. First and foremost, this characterization must be streamlined into
field protocols. Because field time is valuable and limited, uncertainty information will not be collected
unless it requires minimal time expenditure. Second, the specific observations, to which uncertainty is
assigned, depend on the map type. Bedrock mapping, for example, requires the determination of whether the rock
at Earth’s surface is directly connected to, and thus is representative of, the rocks below the surface at that
location (attachedness). For comparison, attachedness for surficial mapping is less critical;
attachedness has no relevance for a landslide deposit. Thus, while the identical scale (no evidence, permissive,
suggestive, presumptive, compelling, certain) is useable for all maps, the observations to which they pertain
may vary.
In this contribution, we concentrate on bedrock mapping. We introduce four basic observations that geologists
are likely to encounter at an individual outcrop: (1) attachedness, (2) lithological correlation, (3) 3D
geometry, and (4) kinematics. As noted, each of these observations requires an inference, and the inference
improves with experience. Attachedness is discussed above. Lithological correlation is the
determination of whether a particular rock belongs to a larger group of rocks (e.g., a named formation). We
expect the majority of uncertainty will be due to challenges inherent in evaluating nuances in rock properties
to correlate to a known unit and explicitly recognize that a professional geologist will be able to determine
rock type at any outcrop (e.g., granitoid), although ambiguities in rock type (e.g., tonalite vs. granodiorite)
can also be reflected in this category. Three-dimensional geometry describes how accurately one can
quantify the internal spatial features of an outcrop. An example of 3D geometry is the determination of strike
and dip of bedding, which is measurable to approximately ±3° for both measurements given the natural variability
of rock. However, there are multiple cases where one is not certain of the 3D geometry, such as non-planar
bedding measurements (e.g., cross bedding). Kinematics is an interpretation of movement associated with
the rock. Kinematics could include primary (e.g., paleocurrents) or secondary (e.g., fault offset) features.
We identified these four aspects of an outcrop to retain potentially valuable information in one aspect (e.g.,
lithology) that might have been lost due to uncertainty in some other feature (e.g., attachedness). The features
are not completely independent. For example, a low certainty ranking for attachedness would necessarily indicate
that the geometry is unlikely to reflect the orientation of the underlying rocks. However, some features are
more independent. For example, lithology can be accessed independent of attachedness or geometry, and conversely
geometry and kinematics can be observed compellingly in some cases even when the lithologic unit is uncertain.
An Example of Better Geology Enabled: Sage Hen Flat Pluton, California
Background
We provide an example of the use of uncertainty scales from the Sage Hen Flat pluton in the White-Inyo
mountains of eastern California. The plutonic bodies of the White-Inyo range intrude into a nearly continuous
section of exposed Late Precambrian–Paleozoic strata that are weakly metamorphosed and deformed by multiple
generations of Paleozoic folding (e.g., Stevens et al., 1997). However, the Late Jurassic Sage Hen Flat pluton
is unique among these intrusions because its emplacement does not disrupt any of the regional structural trends
(Morgan et al., 2000).
The relevance of the Sage Hen Flat pluton for our study is that there are two geological maps—both done by
professional geologists with significant mapping experience—that disagree in both map pattern and cross section
(Figs. 2 and 3). The Ernst and Hall (1987; afterward E&H) map was part of a regional map of the White
Mountains. The Bilodeau and Nelson (1993; afterward B&N) map focused solely on the Sage Hen Flat pluton. For
our purposes, the geological maps are models based on data. There are places where the data are clearly
distinguished from inferences: the strike-and-dip symbols, solid contacts between units, etc. The cross sections
are models and are necessarily more speculative than the geological maps because of the lack of sub-surface
information.
 Figure
2
Figure
2
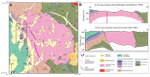
(A) Geological map (modified from Bilodeau and Nelson, 1993) and two different cross sections depicting
different models for the regional geology. The Bilodeau and Nelson (1993) cross section (B, line A–A') indicates
an intrusive contact for the Sage Hen Flat pluton. The Ernst and Hall (1987) cross section (B, line D–D')
depicts the western edge of the Sage Hen Flat pluton as a faulted contact. The box on the geological map (A)
shows the location of Figure 3. Both cross sections lines (A–A' and D-D') cross the area shown in Figure 3.
 Figure
3
Figure
3
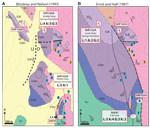
Geological maps of the northwest corner of the Sage Hen Flat pluton extracted from the geological map of (A)
Bilodeau and Nelson (1993) and (B) Ernst and Hall (1987). The circled numbers show the location and attachedness
values (blue = 1, 2; yellow = 3–5) for granitic outcrops discussed in the text. These data are part of the
public “Sage_Hen_Flat_Tikoffetal” project on StraboSpot.org. L—lithology; A—attachedness; G—geometry;
K—kinematics. See Figure 2 for legend.
The difference between the geological maps is most prominent in the northwestern corner of the pluton, which is
highlighted in Figure 3. The E&H map interprets the local geology as recording a fault contact between Sage
Hen Flat granite and country rock on the western margin of the pluton. The B&N map indicates that the
plutonic contact on the western margin is intrusive. We focused our efforts in this location to investigate the
interplay of data and model uncertainty, reasoning that the likely cause of the model uncertainty—as indicated
by their disagreement—was data uncertainty.
Application of the Uncertainty Scales
The existence of two differing models for the geometry and origin of some features is not unique in geology,
but it is particularly well illustrated in the case of the Sage Hen Flat pluton. We remapped the pluton in the
summers of 2019 and 2021 in order to construct and then utilize uncertainty scales that are applicable to field
geology. The data were recorded in the StraboSpot system with the uncertainty values noted. The publicly
available full data set contains 461 stations with notes on the geological features, associated uncertainty, and
photographs (“Sage_Hen_Flat_Tikoffetal” project on StraboSpot.org). Uncertainty for attachedness and lithology
were collected on the 0–5 scale outlined above. Geometry information was collected in those cases in which: (1)
attachedness was 2/5 or higher, and (2) a bedding or foliation was possible to measure. Kinematics were only
noted in a few locations where kinematic features, in this case fault traces, were present.
Our intention is not to find that one mapping team is wrong and one is right. Rather, our objectives are to (1)
understand what data drove the previous interpretations; and (2) demonstrate that showing uncertainty allows
geologists to make an informed judgment.
Station SHF165A (Fig. 3) shows a location for which there is agreement between B&N, E&H, and our data.
We are explicit in our evaluation of attachedness, lithology, and geometry: A practitioner can determine how
much to trust our data. In contrast, we interpret that if B&N or E&H took a measurement, they likely did
so only in cases for which attachedness was presumptive (3/5) or higher.
For Station SHF152 (Fig. 3), the B&N and E&H maps are in conflict. Our data suggest that B&N is
incorrect in mapping it as a granite: The outcrop is a carbonate, although it is bleached, potentially by fluids
expelled from the nearby Sage Hen Flat pluton. The E&H map indicates that the outcrop is the Reed (dolomite)
Formation. We are less certain, because of the metasomatic alteration, but assign this outcrop to the Deep
Springs Formation (1/5). If the B&N data are incorrect, does it alter their model for the
margin of the pluton? In our opinion, the answer is no. It is relatively uncritical if this outcrop consists of
granite or carbonate with respect to their model of an intrusive contact.
The more interesting case are the outcrops of Sage Hen Flat granite (Fig. 3): Blue circles show location of
outcrops with low attachedness rankings (1/5 or 2/5), whereas yellow circles distinguish outcrops with high-
attachedness rankings (3/5 or higher). Note that both maps are consistent with our high attachedness ranking
outcrops. The difference is that there are numerous low-attachedness ranking outcrops that are consistent with
the B&N map but not the E&H map (Fig. 3). Outcrop 103A (Fig. 3) shows one such example; although
attachedness is low, most geologists would likely interpret that these rocks are nearly in place, as there is no
reasonable process that could have moved them from elsewhere. We now ask the critical question of the E&H
map: Do the incorrect data alter their model for the margin of the pluton? The answer, for us,
is yes. The existence of abundant granite outcrops west of their interpreted fault—where no granites should
outcrop—suggests that the model has more uncertainty than that of B&N.
At Station SFH081 (Fig. 3), the Lower Deep Springs Formation strikes into the Campito Formation, and both units
display similar bedding orientations. A fault is shown on the B&N map but not on the E&H map. We judge
the presence of this fault to be compelling (4/5). In this case, we can also investigate the kinematics. There
is not an exposed fault surface with slickensides, and the movement cannot be resolved by stratigraphic offset.
Geometrically, the fault movement could be N-side-down, dextral, or some combination. We rank the kinematics as
suggestive (2/5) and, similar to B&N, would not indicate fault movement using a symbol on the map.
Discussion
Data Uncertainty
Our uncertainty evaluations at the northwestern corner of the Sage Hen Flat pluton provide more robust field
data than previously available. Geologists are already making these types of evaluations, but they are not doing
it systematically, using a shared vocabulary, or storing the evaluations in a format that other geologists can
access.
In our opinion, the data we present are more useful than the data that B&N and E&H provided, largely
because our data collection system includes uncertainty. The advantages of our approach are (1) we have created
methods to record the data that are accessible, so the community—including geologists who have not physically
been there—can evaluate it and offer alternative geological inferences; (2) the collected data are nuanced,
which allows all interested members of the community to consider how much to rely on a specific measurement; (3)
we collected more data because we had a digital system that allowed us to collect it quickly; (4) the data are
less filtered, as we were willing to collect low-certainty data because we could identify it as such; and (5)
the need to explicitly evaluate uncertainty at every station motivated us to evaluate each outcrop
independently, which reduces bias by reducing the influence of preconceptions (about the adjacent outcrops,
regional geology, existing models, etc.).
Model Uncertainty
Our approach allows us to make better models through (1) the use of shared language to characterize the quality
of the model; (2) the use of more robust field data (more data, stored in an accessible way,
with quality evaluations); and (3) the ability to more closely link the quality of the data to the
quality of the model. We apply these concepts to the two models for the western margin of the Sage Hen
Flat pluton: (1) a faulted contact (E&H; Fig. 2B), and (2) an intrusive contact (B&N; Fig. 2B).
Prior to spending time in the field, we evaluated both the E&H and B&N models as “suggestive.” Having
collected data in this area, we promote the B&N model to “presumptive” and keep the E&H model as
“suggestive.” The data that we collected that are not consistent with the B&N model (e.g., SHF152A; Fig. 3)
are nevertheless consistent with the processes interpreted in their cross section. In contrast, some of our data
do not support the E&H model; the granitic outcrops with low attachedness rankings in the southern part of
the area shown in Figure 3 are inconsistent with a faulted contact. Thus, although the E&H model remains
suggestive (in the 25%–50% likely category), it is less likely than the B&N model. We note that in any field
area, a compelling or even presumptive model may not exist, because the nature of the outcrop quality or the
complexity of the region does not allow the true relationships to be discerned.
Our assessment applies only to a small area (Fig. 3) of the E&H and B&N maps, but illustrates a
structured way to engage in assessments of model certainty. In particular, it addresses where models are
uncertain and the level of that uncertainty. A critical point is that we are not trying to determine which model
is correct: Our evaluation is more nuanced than one model is right and the other one is wrong. In large part,
both models are well supported by high-certainty field data. It is unclear that additional geological mapping,
by itself, would further adjudicate between the existing models.
Data Uncertainty and Model Uncertainty Interaction
Data uncertainties interact with the model uncertainties in a variety of different ways. The influence of data
uncertainty on model generation is clear. All scientists likely recognize that one’s interpretation can only be
as good as one’s data. For a sparse data set from an area where exposures are limited, model uncertainty is
closely tied to the underlying data uncertainty. Thus, compelling models are made with consistent, compelling
data. In contrast, permissive models are made with either consistent permissive data or a mix of inconsistent
suggestive, presumptive, and compelling data. As data sets get larger, these relationships change. For example,
a large number of consistent, permissive data could support a suggestive (or more certain) model. These
relations can be developed statistically in the future as the community develops its facility with digital
methods.
Most geologists engage in model comparison, but they are not doing it explicitly or consistently when
collecting data. Model uncertainty guides data collection in areas where data can distinguish between different
models. For this reason, we focused our work on the northwestern corner of the Sage Hen Flat pluton, where there
was a clear need to collect unbiased data in order to evaluate competing models. Note the similarity of our
approach to that of Gilbert (1886). The use of model uncertainty produces the same cognitive advantages as
Gilbert’s idea of multiple working hypotheses, particularly in debiasing of data collection.
We argue that we can make a fundamental improvement to the approach of Gilbert by focusing on data rather than
models. This approach is facilitated by the use of digital data systems coupled with a workflow informed by
cognitive science. In the absence of digital tools, people reason using models because there is no effective way
for the mind to keep track of all of the data and its attendant uncertainties. Digital data systems
offload this cognitive burden, which in turn can improve estimates of relative model certainty. This process
encourages data collection—particularly of unexpected features and/or low-certainty data—that can provide new
model insights and transform practice. Marginal data in bulk can provide better estimators than sparse data to
refine spatial and non-spatial interpretations. Data analytics developed for field-collected data uncertainty
could prove to be a key for developing robust quality control and quality assurance for digital data systems.
Recording geologists’ uncertainty allows transparent connections between uncertainty in data and the
uncertainty in models. One can produce better models because one can evaluate the quality of the data upon which
the model is built. Critically, the geologists who have used the uncertainty scales in the field do not find
them cumbersome or overly time consuming. The use of uncertainty simultaneously could increase a scientist’s
trust of data types outside of their expertise as they could rely on the evaluation of uncertainty by others.
Communicating the uncertainty in data and models may reduce the barriers to model revision or replacement and
speed the advance of science.
Future Work
The presented workflow provides one possible approach for geologists to capture and communicate uncertainty in
data and models. Although it is not meant to be prescriptive, it exhibits important attributes for gathering
uncertainty information for field practitioners: (1) it does not interfere with workflow, (2) it facilitates
transparent data collection, (3) it captures uncertainty about a manageable number of categories, and (4) the
results are replicable and psychologically meaningful. These guidelines may be useful to other communities using
field-based data that adopt the collection of uncertainty data to support their research needs.
This contribution aims to improve the quality of field-based geologic information through the explicit
communication of uncertainty and the manner in which that uncertainty is communicated. There are, however, other
discussions that need to be held at a community level. For example, practitioners in bedrock mapping may want to
develop new conventions for visually communicating uncertainty. It may be time—with cognitive scientists
involved in the process—to update how we record, represent, and communicate geologic information.
Conclusions
It is generally recognized that science and society are undergoing a digital revolution. The geological
community has the opportunity to adapt best practices of the past to the emerging new workflows that result from
the ability to operate digitally. We propose the systematic use of uncertainty scales when collecting digital
field data and developing models, which are easily recorded by digital technologies, as better science practice.
We applied the use of uncertainty scales to bedrock mapping at the Sage Hen Flat pluton in eastern California,
where different data resulted in different models for the regional geology. New data was collected in the area
of most divergence between the two geological maps. The purpose of our evaluation was to show how data that
contain uncertainty estimates provide a fundamentally better record of geological field data, can adjudicate
between different models, and can guide future research. The language associated with the data and model
uncertainties can also allow nuanced (e.g., non-binary) decisions and facilitate productive communication
between researchers.
Acknowledgments
Robert Dott provided a version of an “evidence meter,” which he modified from an earlier effort by Preston
Cloud. S. Morgan, M. St. Blanquat, R. Law, A. Glazner, and J. Bartley all provided data and/or information about
the Sage Hen Flat pluton. J. Newman and J.D. Walker are thanked for multiple conversations about how to
incorporate uncertainty into StraboSpot. The concept for the map comparison in Figure 3 came from an informal
student presentation by L.D. Wilson, J.D. Higdon, and J.A. Davidson (from A. Glazner, pers. commun., 2022).
Reviews by Steve Reynolds and two anonymous reviewers helped us improve the manuscript. This work was supported
by the National Science Foundation under Grant NSF DUE 1839705 (TS) and 1839730 (BT), and NSF EarthCube 192973
(BT).
References Cited
- Alcalde, J., Bond, C.E., Johnson, G., Butler, R.W.H., Cooper, M.A., and Ellis, J.F., 2017, The importance of
structural model availability on seismic interpretation: Journal of Structural Geology, v. 97, p. 161–171,
https://doi.org/10.1016/j.jsg.2017.03.003.
- Bilodeau, B.J., and Nelson, C.A., 1993, Geology of the Sage Hen Flat Pluton, White Mountains, California:
Geological Society of America Map and Chart Series MCH077, scale 1:24,000, 1 sheet, 18 p.
- Bond, C.E., Shipton, Z.K., Gibbs, A.D., and Jones, S., 2008, Structural models: Optimizing risk analysis by
understanding conceptual uncertainty: First Break, v. 26, https://doi.org/10.3997/1365-2397.2008006.
- Ernst, W.G., and Hall, C.A., 1987, Geology of the Mount Barcroft–Blanco Mountain Area, Eastern California:
Geological Society of America Map and Chart Series MCH066, scale 1:24,000, 1 sheet.
- Gilbert, G.K., 1886, The Inculcation of the Scientific Method by Example, with an Illustration Drawn from
the Quaternary Geology of Utah: American Journal of Science, v. 31, p. 284–299,
https://doi.org/10.2475/ajs.s3-31.184.284.
- Hanawalt, N.G., 1942, The effect of practice upon the perception of simple designs masked by more complex
designs: Journal of Experimental Psychology, v. 31, p. 134–148, https://doi.org/10.1037/h0061522.
- Kastens, K.A., and Ishikawa, T., 2006, Spatial thinking in the geosciences and cognitive sciences: A
cross-disciplinary look at the intersection of the two fields, in Manduca, C.A., and Mogk, D.W.,
eds., Earth and Mind: How Geologists Think and Learn about the Earth: Geological Society of America Special
Paper 413, p. 53–76, https://doi.org/10.1130/2006.2413(05).
- Leahy, G.M., and Skorstad, A., 2013, Uncertainty in subsurface interpretation: A new workflow: First Break,
v. 31, https://doi.org/10.3997/1365-2397.31.9.71079.
- Maniscalco, B., and Lau, H., 2012, A signal detection theoretic approach for estimating metacognitive
sensitivity from confidence ratings: Consciousness and Cognition, v. 21, p. 422–430,
https://doi.org/10.1016/j.concog.2011.09.021.
- Marshak, S., 2009, Essentials of Geology, third edition: New York, W.W. Norton and Company, 628 p.
- Morgan, S.S., Law, R.D., and Blanquat, M. de S., 2000, Papoose Flat, Eureka Valley–Joshua Flat–Beer Creek,
and Sage Hen Flat plutons: Examples of rising, sinking, and cookie-cutter plutons in the central White–Inyo
Range, eastern California, in Lageson, D.R., Peters, S.G., and Lahren, M.M., eds., Great Basin and
Sierra Nevada: Geological Society of America Field Guide 2, p. 189–204,
https://doi.org/10.1130/0-8137-0002-7.189.
- Preston, C.C., and Colman, A.M., 2000, Optimal number of response categories in rating scales: Reliability,
validity, discriminating power, and respondent preferences: Acta Psychologica, v. 104, p. 1–15,
https://doi.org/10.1016/S0001-6918(99)00050-5.
- Reynolds, S.J., 2012, Some important aspects of spatial cognition in field geology, in Manduca,
C.A., and Mogk, D.W., eds., Earth & Mind II: Synthesis of Research on Thinking and Learning in the
Geosciences: Geological Society of America Special Paper 486, p. 75–78, https://doi.org/10.1130/2012.2486(12).
- Stevens, C.H., Stone, P., Dunne, G.C., Greene, D.C., Walker, J.D., Swanson, B.J., Ernst, W.G., and Skinner,
B.J., 1997, Paleozoic and Mesozoic evolution of east-central California: International Geology Review, v. 39,
p. 788–829, https://doi.org/10.1080/00206819709465303.
- Walker, J.D., Tikoff, B., Newman, J., Clark, R., Ash, J., Good, J., Bunse, E.G., Moeller, A., Kahn, M.,
Williams, R., Michels, Z., and Rufledt, C., 2019, StraboSpot data system for structural geology: Geosphere, v.
15, p. 533–547, https://doi.org/10.1130/GES02039.1.