Introduction
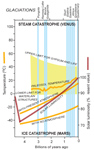
The faint young sun paradox arises from stellar evolution of increased solar luminosity through time
(Ribas, 2009), which predicts frigid temperatures on early Earth, with or without present atmosphere
(Fig. 1). However, moderate Archean temperatures are inferred from salt stability, water-lain
sedimentary structures, and glacial episodes (Walker, 1982). Paleotemperatures from paleosols (Fig. 1)
are evidence of long-term stability (Retallack, 2013, 2018; Retallack et al., 2016), averting terminal
freezing, apparent from Mars, as well as the other extreme of an uninhabitable inferno, apparent from
Venus (Lovelock and Margulis, 1974). Both freezing and steaming may have been prevented by greenhouse
gases such as CH4 and CO2 regulated by the biological carbon cycle (Schwartzmann,
2017). Continued volcanic degassing of CO2 prevented a terminal icehouse, whereas building of
biomass and consumption of carbonic acid by biotically enhanced silicate and apatite weathering
prevented a terminal greenhouse (Retallack, 2022a). Consumption of CO2 by abiotic silicate
weathering in lifeless Precambrian landscapes was modeled by Rye and Holland (1998), but a role for life
on land enhancing weathering is indicated as far back as 3.7 Ga by paleosol salts, stable isotopic
compositions, and phosphorus depletion (Retallack, 2022b). Thus, theoretical concepts of biotic
planetary temperature regulation can now be assessed from the record of fossil soils back to 3.7 Ga.
Generally declining atmospheric CO2 over time (Kasting, 2010) is not the only issue involved,
because soil CO2 increased with increased productivity of terrestrial vegetation (Retallack,
2022b). Paleosols are not only evidence of carbon sequestration by silicate and apatite weathering, but
also include fossils as evidence of the evolution of life on land.
 Figure
1
Figure
1
Stellar evolution and planetary temperature and atmospheric composition over the past 4.6 Ga, showing
solar luminosity increase and predicted temperature of Earth with current atmosphere or no atmosphere
(Ribas, 2009), envelope of permitted temperatures from gypsum and life (Walker, 1982), temperatures
inferred from selected paleosols (Retallack, 2013, 2018; Retallack et al., 2016), and ice ages (Walker,
1982).
Paleosols as Proxies for Carbon Sequestration
Paleosols are soils of the past, buried in sedimentary or volcanic sequences, and interpretable by
comparison with modern soils. Release of soluble alkali and alkaline earth cations and bicarbonate into
soil solution by carbonic acid from CO2 in solution can be simplified to Equations 1–4,
showing that each mole of oxide consumed 2 moles of CO2:
(1)
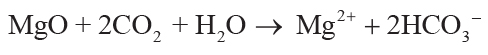
,
(2)
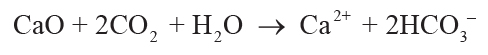
,
(3)
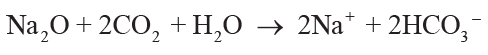
,
(4)
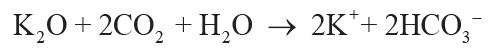
.
Losses of these elements from soils on a molar basis is a proxy for moles of CO2 consumed by
soil over its time of formation (Sheldon, 2006). Whole profile loss can be envisaged as the area under
the curves in mole fraction alkali and alkaline earth depletion for decompacted paleosols (Fig. 2).
 Figure
2
Figure
2
Base and phosphorus depletion in a 550 Ma paleosol from South Australia as an example of output data for
each reconstructed paleosol. Parent material was chosen on the basis of petrographic, titania, and
sesquioxide similarity detailed elsewhere (Retallack, 2013).
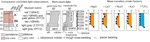
Dissolution of apatite as a source of P can be reduced to Equation 5, in which 1 mol of CO2 in
aqueous solution liberates 3 moles of soluble phosphate from apatite:
(5)
.
This is a simplification of four intermediate apatite dissolution reactions and other intermediate
reactions producing carbonic acid from CO2 in solution (Dorozhkin, 2012). Actual phosphate
procurement in soils from relatively insoluble apatite is catalyzed by a variety of carbon-based acid
moieties, such as acetic and oxalic acid with higher mole fractions of carbon (Neaman et al., 2005).
Another complication is that Archean apatite dissolution also may have been partly achieved by strong
sulfuric acid, rather than weak carbonic acid (Retallack, 2022c). Again, this is based on mass transfer,
including volume loss during soil formation with depth in reconstructed soils as they would have been
before burial compaction and metamorphism (Sheldon, 2006).
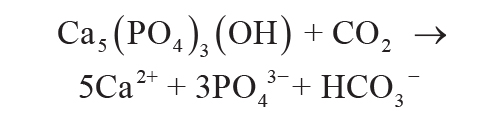
Original soils can be reconstructed from paleosols by estimating compaction due to burial by overburden
(C as %) from total depth of burial (B in km) and suitable physical constants, in this
case taken from Aridisols (Sheldon and Retallack, 2001):
(6)
.
Tau analysis of paleosols (Brimhall et al., 1992) calculates mole fraction mass transport
(τj,w) of a mobile element and mole fraction strain (εi,w) of the profile during
soil formation using an immobile element from the parent material (Ti used here). Equations 7–8 for mass
transport and strain include bulk density (ρ in g.cm–3) and oxide assay (C in wt%)
for successive samples (subscripts i, j) of weathered material (subscript w)
and parent material (subscript p) of a single paleosol profile:
(7)
,
(8)
.
Soils and paleosols lose mass with weathering and so have negative strain (εi,w < 0),
and
also lose nutrient cations and silica, so have negative mass transfer (τj,w < 0). In
contrast, sediment accumulation and diagenetic alteration add elements and mass, so have positive strain
and mass transfer. Moles of CO2 used to displace alkali and alkaline earths during weathering
assessed by tau analysis (Equations 7–8) can be used to calculate soil CO2 (ppm) consumed by
the whole profile during its formation using Equations 9–11 (modified from Sheldon, 2006). Components of
these calculations are areas under the curves of depletion of bases or phosphorus in reconstructed
paleosol profiles, calculated for the whole profile for a square centimeter of surface area of the
profile (Fig. 2):
(9)
,
(10)
,
(11)
.
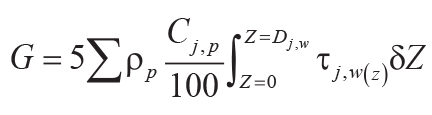
Variables and constants for these calculations besides those needed for Equations 6–8 are F (mol
CO2.cm–2) = summed molar mass transfer loss of CaO, MgO, Na2O, and
K2O using Equation 9; G (mol CO2.cm–2) = summed molar mass
transfer loss of P using Equation 10; Z (cm) = depth in soil represented by analysis corrected
for compaction using Equation 10; A (years) = duration of soil formation using Equations 12 and
13; KCO2 (mol./kg.bar) = Henry’s Law constant for CO2 (=0.034, range
0.031–0.0045); P (cm) = mean annual precipitation using Equation 13; κ
(s.cm3.[mol.year]–1) = seconds per year divided by volume per mole of gas at
standard temperature and pressure (=1430); DCO2 (cm2.s–1) =
diffusion constant for CO2 in air (=0.162); α (fraction) = ratio of diffusion constant for
CO2 in soil divided by diffusion constant for CO2 in air (=0.1, range 0.08–0.12);
L (cm) = original depth to water table (after decompacted using Equation 6).
The duration of soil formation in years (A in k.y.) can be calculated from carbonate nodule
diameter (D in cm: r2 = 0.57, s.e. = 1.8, p = <0.001) for calcareous soils
(Retallack, 2005), or thickness of profile (T in cm: r2 = 0.79, s.e. = 140, p =
0.01) for non-calcareous unconformity paleosols (Markewich et al., 1990):
(12)
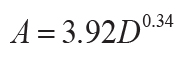
,
(13)

.
Mean annual precipitation (P in mm) can be obtained by the CIA-K proxy, effectively a chemical
index of alteration without diagenetically problematic K (I as mole fraction: r2 =
0.72, s.e. = 182, p = <0.0001; Sheldon et al., 2002), or compaction-corrected depth to calcic horizon
(D in cm: r2 = 0.52, s.e. = 147, p = <0.0001; Retallack, 2005):
(14)
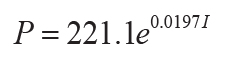
,
(15)
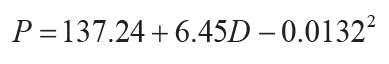
.
The normalized value of μmol F.cm2.mm–1.a–1, where F
is the sum of the four alkaline and alkaline earth bases, or μmol
G.cm2.mm–1.a–1, where G is the sum of phosphorus
depletions, become proxies for global CO2 consumption if multiplied by modal mean annual
precipitation, which is 764 mm in the modern world, with a standard error of 704 mm (Beck et al., 2005).
This modal mean annual precipitation may have changed in deep time, but the current understanding of
paleoprecipitation from paleosols shows mainly arid to subhumid estimates (Retallack, 2013, 2018;
Retallack et al., 2016), comparable with today (Beck et al., 2005). Estimates of exposed land area in
deep time are from published areas of continental crust and hypsometric curves (Cawood and Hawkesworth,
2019). These changing land areas were proportionally scaled to a modern land area of 148,429,000
km2, and carbon consumption to modern global silicate weathering (Ciais et al., 2013) of 0.3
PgC.a–1 (Pg = 1015g). Carbon consumption by silicate weathering can be calculated
from stoichiometry of Equations 1–4 and carbon consumption by apatite weathering from stoichiometry of
Equation 5.
Database, Error Calculations, and Alternatives
Detailed accounts of each of the paleosols used in the compilation for these calculations have all been
published elsewhere: citations and component data, including error estimates for individual profiles,
are listed in the supplemental material1. Criteria for quality of data outlined by Rye and
Holland (1998) were used to select paleosols for the compilation. Full petrographic and geochemical
data, as well as bulk density determinations, were essential for all horizons (Equations 7 and 8). Also
needed was evidence of at least moderate development, such as argillic, calcic, or gypsic horizons
(Retallack, 2013, 2018, 2022b). To be included, paleosols had to have chemical weathering demonstrated
by tau analysis (Brimhall et al., 1992). Weakly developed, gleyed, and inadequately documented paleosols
were not included. The paleosol database includes profiles on bedrock unconformities (Rye and Holland,
1998), as well as within sedimentary sequences (Retallack, 2013, 2018, 2022b). Virtually all suitable
Precambrian paleosols are included in the database, along with most suitable Phanerozoic paleosols for
which data was available. Errors for the calculations were based on standard errors of transfer
functions (Equations 12–15) and Gaussian error propagation from partial derivatives of transfer
equations summed in quadrature as outlined by Retallack et al. (2021).
Some of the transfer functions used are compromised by other variables: Equations 14 and 15 for
paleoprecipitation include components of temperature (Sheldon et al., 2002) and paleoproductivity,
respectively (Breecker and Retallack, 2014), which contribute to cited standard errors. Warmth and high
precipitation can also compromise age estimates of paleosols using nodule size (Retallack, 2005) and
depth of weathering (Markewich et al., 1990), again within standard error of the data used for the
transfer function. Although individual paleosol depletion rate standard deviations were small, the
variance of estimated depletion rates is large, so rates were pooled by 500-m.y. increments to calculate
standard deviations as the height of the open box (Fig. 3).
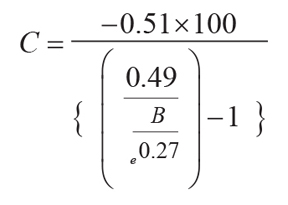
 Figure
3
Figure
3
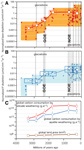
Base (A) and phosphorus depletion (B) and carbon consumption (C) inferred from tau analysis of paleosols
over the past 3.7 Ga. (A–B) Closed symbols are individual paleosols, and large open symbols are mean for
500 Ma intervals. Only a single paleosol is known for 1000–500 Ma. (C) Annual rates of C consumption
from base depletion and apatite weathering (see supplemental material [see text footnote 1]) and global
land area increase calculated from continental area and freeboard estimates (Cawood and Hawkesworth,
2019). Upper and lower box bounds and error bars are two standard deviations. GOE—Great Oxidation Event;
NOE—Neoproterozoic Oxidation Event.
Stepwise Biotic Enhancement of Weathering
The results of mass transfer calculations of paleosols ranging back in age to 3700 Ma show three orders
of magnitude increases in nutrient depletion of both phosphorus and alkali and alkaline earths, but on
different time schedules (Figs. 3A–3B). Most of the range of alkali and alkaline earth depletion was
achieved by the Great Oxidation Event (GOE) of 2.45 Ga, but phosphorus depletion rose markedly at both
the GOE and the Neoproterozoic Oxidation Event (NOE) of 0.8 Ga. These changes may reflect increased
rates of nutrient procurement due to increased biological productivity at those times.
Alkali and alkaline earth depletion rose steadily from 3.5 to 2.4 Ga under acid-sulfate weathering by
anaerobic bacterial soil microbiomes (Retallack, 2018; Retallack et al., 2016), now restricted to
waterlogged soils and playa lakes (Benison and Bowen, 2015). Alluvial paleosols from 3.5 to 3.0 Ga
contain desert roses of sulfate minerals, such as barite and gypsum, as evidence for weathering by
strong sulfuric acid rather than weak carbonic acid (Retallack, 2018; Retallack et al., 2016). The
microbiome of desert rose paleosols dated to 3.0 Ga is permineralized with silica, and its microfossils,
analyzed for cell-specific carbon-isotopic-composition, reveal an anaerobic community of purple sulfur
bacteria, actinobacteria, and methanogens (Retallack et al., 2016).
Other paleosols in the data set formed in humid climates on bedrock (supplemental material [see footnote
1]) and were thick, clayey profiles, with little evidence of soluble salts (Rye and Holland, 1998).
These do not stand out as anomalies in Figure 3 compared with paleosols with soluble salts (Retallack,
2022c) because they were normalized for mean annual precipitation (Equations 12–13) and duration of
formation (Equations 14–15). CO2 consumption rates of Paleoproterozoic and Archean paleosols
are too low (Fig. 4) to explain paleotemperatures under a faint young sun (Kasting, 2010). Likely sulfur
bacteria and methanogens in paleosols support the idea that other greenhouses gases, such as methane,
ethane, and SO2, formed a greenhouse haze (Haqq-Misra et al., 2008). Modeling of methane
production rates from a P-limited and SO4-poor Archean ocean would not have produced enough
methane for a significant CH4-greenhouse (Laakso and Schrag, 2019), but anaerobic
methanogenesis would have been more widespread in well-drained Archean soils than its current geographic
limitation to waterlogged wetlands (Benison and Bowen, 2015). Another Archean warming possibility is
three times the current mass of atmospheric N2 and a H2 0.1 mixing ratio
(Wordsworth and Pierrehumbert, 2013). This seems unlikely because N2 in the atmosphere was
limited to 1.1–0.5 bars judging from nitrogen and argon isotopic ratios in fluid inclusions dated to
3500 Ma (Marty et al., 2013), and total atmospheric pressure at 2700 Ma may have been only half modern
judging from the size of lava vesicles and raindrop impressions (Som et al., 2016).
 Figure
4
Figure
4
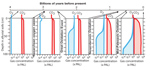
Idealized range of soil gas distributions on Earth over the past 4 billion years. Gas concentrations
varied within the envelope shown depending on seasonal productivity and waterlogging, and atmospheric
levels of gases inferred from paleosol consumption are shown at the surface. PAL—preindustrial
atmospheric level (280 ppm).
The Archean acid-sulfate weathering style was geographically limited by late Archean spread of carbonic
acid weathering, which dominated after the 2.45 Ga GOE (Rye and Holland, 1998). The rise of
cyanobacteria as part of a largely freshwater and terrestrial clade of “Terrabacteria” (Battistuzzi and
Hedges, 2009) maintained soil productivity, promoting perineutral carbonic acid hydrolysis and free
oxygen in both soil and air (Fig. 4). Perineutral pH in soils by 2.4 Ga is indicated by pedogenic
carbonate in paleosols of that age and in aridland soils ever since (Pekkarinen, 1979). Thus, hydrolytic
weathering systems geographically displaced archaic acid-sulfate weathering, now limited to areas of
sulfide ore weathering and anaerobic parts of waterlogged soils and lakes (Benison and Bowen, 2015).
Phosphorus depletion of paleosols rose during the GOE, and again during the NOE (Fig. 3B). The
Neoproterozoic does not signify a fundamental change in style of weathering, but rather the evolution of
more effective biologically produced ligands, which were mainly bacterial during the GOE, but
supplemented by more effective ligands of fungi and lichens during the Neoproterozoic (Neaman et al.,
2005; Retallack, 2013; Kump 2014). Both increases in terrestrial productivity coincide in time with
Snowball Earth cooling events (Walker, 1982; Kasting, 2010).
Implications for Soil Gases in Deep Time
Some of these same paleosols also have been used to calculate CO2 consumption as a guide to
atmospheric evolution (Sheldon, 2006; Retallack et al., 2021), but they are imperfect guides to the
atmosphere. Today, soils may have up to three orders of magnitude more CO2 than the
atmosphere because of soil respiration, and three orders of magnitude less O2 due to
waterlogging (Elberling et al., 2011). The differences in CO2 and O2 from the
atmosphere are less marked in well-drained soils with open-soil structure (Kyaw Tha Paw et al., 2006).
Calculations of gas consumption from paleosols (Sheldon, 2006; Retallack et al., 2021), combined with
modern soil gas measurements (Elberling et al., 2011; Kyaw Tha Paw et al., 2006), allow idealized
hypotheses for gas concentrations within well-drained alluvial soils over the past 3.7 billion years
(Fig. 4). Both O2 and CO2 are higher in modern than in Precambrian soils, and
geologically younger soils show more variable concentrations with seasons, within profiles, and
geographically (Breecker and Retallack, 2014). Thus, biotic enhancement of weathering was not just a
matter of changing the atmosphere (Kasting, 2010), because soil gases at the site of silicate and
apatite weathering were critical (Kump, 2014). Neoproterozoic consumption of CO2 was less by
increased silicate weathering than by increased apatite weathering (Fig. 3), suggesting a role for
ligands from life on land (Neaman et al., 2005). With later evolution of land plants, soil
CO2 rose orders of magnitude higher than in the atmosphere, supplying carbonic acid for both
silicate and apatite weathering (Berner, 1997; Retallack, 2022a, 2022b).
Estimates of CO2 consumption by Paleo-proterozoic and Archean soils do not show expected
(Kasting, 2010) high amounts of soil or atmospheric CO2 (Sheldon, 2006; Retallack, 2018;
Retallack et al., 2016, 2021). Common sulfates formed in Archean paleosols despite low atmospheric
O2 suggest that strong sulfuric acid produced by anaerobic sulfur oxidizing bacteria,
creating more amorphous colloids such as imogolite than clay, may have been more important than weak
carbonic acid in Archean silicate weathering (Retallack, 2018; Retallack et al., 2016). Paleoproterozoic
atmospheric oxidation raised rates of atmospheric CO2 consumption by both oxidative silicate
and apatite weathering from aerobic cyanobacteria and actinobacteria, but increases in apatite, not
silicate, weathering rates are seen in the Neoproterozoic (Fig. 3), perhaps from newly evolved
fungal-lichen microbial earths (Retallack, 2013; Kump, 2014). The advent of land plants did draw down
atmospheric CO2 (Berner, 1997) but did not appreciably alter rates of CO2
consumption by either silicate or apatite weathering at the coarse 500-m.y. scale of this investigation
(Fig. 3). During the past 16 million years, range expansion and contraction of carbon-hungry soils such
as Mollisols and Oxisols, with reciprocal adjustment of carbon-lean soils such as Gelisols and Aridisols
have acted as a planetary thermostat. Mollisol-Oxisol expansion curbs greenhouse CO2 spikes,
but Gelisol-Aridisol expansion cannot override continued volcanic degassing of CO2
(Retallack, 2022a). Too few Archean paleosols are now known to demonstrate such counterbalancing carbon
sequestration, but biotic enhancement of weathering is suspected then as well. The record of paleosols
reveals that atmospheric and soil CO2 show considerable temporal and presumably also
geographic variation (Fig. 3) but not a monotonic increase (Fig. 4). Nevertheless, carbon sequestration
by silicate weathering and phosphorus depletion did rise (Fig. 4), as predicted in theory (Schwartzmann,
2017).
Comparison with Experiments
Increases of three orders of magnitude in nutrient depletion of individual paleosols (Fig. 3A) and global
carbon sequestration (Fig. 3C) is greater than an estimate of two orders of magnitude of biotic
enhancement of weathering derived from compilation of experimental studies (Schwartzmann, 2017) for
three reasons. First, experimental studies reveal enhancement factors of major steps in terrestrial
productivity, such as the evolution of trees (Retallack, 2022b), and does not consider the origin of
microbial life in soils and prokaryotic evolutionary advances in microbiome weathering. Second, global
carbon sequestration has been aided by the growth of land area through time. The estimates of land-area
increase used here are based on estimates of continental area and paleohypsometry (Cawood and
Hawkesworth, 2019), which are relatively conservative, but show a factor of three, rather than a factor
of 100 increase through time (Fig. 3C). Third, nutrient depletion fuels biomass carbon sequestration
increases of about the same magnitude (Retallack, 2022a). Geographic spread and temporal fluctuation in
areas of various kinds of paleosols will be needed for a full accounting of planetary temperature
regulation by soils, as has been possible for the Neogene fossil record of soils (Retallack, 2022a).
Conclusions
Paleosols are now evidence for progressive CO2 and CH4 greenhouse reduction by
biologically enhanced weathering to offset increased stellar luminosity and continued volcanic
greenhouse gas emission. Biological regulation of soil and atmospheric gases may have maintained
habitable surface conditions on Earth for the past 3.7 Ga.
Acknowledgments
This work is a compilation of research from NSF grants EAR7900898, EAR850323, EAR9103178, OPP931522,
SBR9513175, EAR0000953, and OPP023008, and PRF of American Chemical Society grants 31270 and 45257.
Nathan Sheldon, Jim Kasting, and Paul Knauth offered useful discussion.
References Cited
- Battistuzzi, F.U., and Hedges, S.B., 2009, A major clade of prokaryotes with ancient adaptations to
life on land: Molecular Biology and Evolution, v. 26, p. 335–343,
https://doi.org/10.1093/molbev/msn247.
- Beck, C., Grieser, C.J., and Rudolf, B., 2005, A new monthly precipitation climatology for the
global land areas for the period 1951 to 2000: German Weather Service Offenbach Climate Status
Report, v. 2004, p. 181–190.
- Benison, K.C., and Bowen, B.B., 2015, The evolution of end-member continental waters: The origin of
acidity in southern Western Australia: GSA Today, v. 25, no. 6, p. 4–10,
https://doi.org/10.1130/GSATG231A.1.
- Berner, R.A., 1997, The rise of plants and their effect on weathering and atmospheric
CO2: Science, v. 276, p. 544–546, https://doi.org/10.1126/science.276.5312.544.
- Breecker, D.O., and Retallack, G.J., 2014, Refining the pedogenic carbonate atmospheric
CO2 proxy and application to Miocene CO2: Palaeogeography, Palaeoclimatology,
Palaeoecology, v. 406, p. 1–8, https://doi.org/10.1016/j.palaeo.2014.04.012.
- Brimhall, G.H., Chadwick, O.A., Lewis, C.J., Compston, W., Williams, I.S., Danti, K.J., Dietrich,
W.E., Power, M.E., Hendricks, D., and Bratt, J., 1992, Deformational mass transport and invasive
processes in soil evolution: Science, v. 255, p. 695–702,
https://doi.org/10.1126/science.255.5045.695.
- Cawood, P.A., and Hawkesworth, C.J., 2019, Continental crustal volume, thickness and area, and their
geodynamic implications: Gondwana Research, v. 66, p. 116–125,
https://doi.org/10.1016/j.gr.2018.11.001.
- Ciais, P., and 14 others, 2014, Carbon and other biogeochemical cycles, in Stocker, T.,
ed., Climate Change 2013: The Physical Science Basis: Cambridge, UK, Cambridge University Press, p.
465−570.
- Dorozhkin, S.V., 2012, Dissolution mechanism of calcium apatites in acids: A review of literature:
World Journal of Methodology, v. 2, p. 1–17, https://doi.org/10.5662/wjm.v2.i1.1.
- Elberling, B., Askär, L., Jørgensen, C.J., Jönsen, H.P., Kühl, M., Glud, R.N., and Lauritsen, F.R.,
2011, Linking soil O2, CO2, and CH4 concentrations in a wetland
soil: Implications for CO2 and CH4 fluxes: Environmental Science &
Technology, v. 45, p. 3393–3399, https://doi.org/10.1021/es103540k.
- Haqq-Misra, J.D., Domagal-Goldman, S.D., Kasting, P.J., and Kasting, J.F., 2008, A revised hazy
methane greenhouse for the Archean Earth: Astrobiology, v. 8, p. 1127–1137,
https://doi.org/10.1089/ast.2007.0197.
- Kasting, J.F., 2010, Faint young Sun redux: Nature, v. 464, p. 687–689,
https://doi.org/10.1038/464687a.
- Kump, L.R., 2014, Hypothesized link between Neoproterozoic greening of the land surface and the
establishment of an oxygen-rich atmosphere: Proceedings of the National Academy of Sciences of the
United States of America, v. 111, p. 14,062–14,065, https://doi.org/10.1073/pnas.1321496111.
- Kyaw Tha Paw, U., Xu, L., Ideris, A.J., Kochendorfer, J., Wharton, S., Rolston, D.E., and Hsia,
T.C., 2006, Simultaneous carbon dioxide and oxygen measurements to improve soil efflux estimates:
Kearney Foundation of Soil Science Final Report 2004211, p. 1–8.
- Laakso, T.A., and Schrag, D.P., 2019, Methane in the Precambrian atmosphere: Earth and Planetary
Science Letters, v. 522, p. 48–54, https://doi.org/10.1016/j.epsl.2019.06.022.
- Lovelock, J.E., and Margulis, L., 1974, Atmospheric homeostasis by and for the biosphere: The Gaia
hypothesis: Tellus, v. 26, p. 2–10, https://doi.org/10.3402/tellusa.v26i1-2.9731.
- Markewich, H.W., Pavich, M.J., and Buell, G.R., 1990, Contrasting soils and landscapes of the
Piedmont and Coastal Plain, eastern United States: Geomorphology, v. 3, p. 417–447,
https://doi.org/10.1016/0169-555X(90)90015-I.
- Marty, B., Zimmermann, L., Pujol, M., Burgess, R., and Philippot, P., 2013, Nitrogen isotope
composition and density of the Archean atmosphere: Science, v. 342, p. 101–104,
https://doi.org/10.1126/science.1240971.
- Neaman, A., Chorover, J., and Brantley, S.L., 2005, Implications of the evolution of organic acid
moieties for basalt weathering over geological time: American Journal of Science, v. 305, p.
147–185, https://doi.org/10.2475/ajs.305.2.147.
- Pekkarinen, L.J., 1979, The Karelian formations and their depositional basement in the
Kiihetelysvaar-Värtsilä area, east Finland: Geological Survey of Finland Bulletin, v. 301, p. 1–141.
- Retallack, G.J., 2005, Pedogenic carbonate proxies for amount and seasonality of precipitation in
paleosols: Geology, v. 33, p. 333–336, https://doi.org/10.1130/G21263.1.
- Retallack, G.J., 2013, Ediacaran life on land: Nature, v. 493, p. 89–92,
https://doi.org/10.1038/nature11777.
- Retallack, G.J., 2018, Oldest recognized paleosols on Earth, Panorama Formation (3.46 Ga), Western
Australia: Palaeogeography, Palaeoclimatology, Palaeoecology, v. 489, p. 230–248,
https://doi.org/10.1016/j.palaeo.2017.10.013.
- Retallack, G.J., 2022a, Soil carbon dioxide planetary thermostat: Astrobiology, v. 22, p. 116–123,
https://doi.org/10.1089/ast.2020.2415.
- Retallack, G.J., 2022b, Ordovician-Devonian lichen canopies before evolution of woody trees:
Gondwana Research, v. 106, p. 211–223, https://doi.org/10.1016/j.gr.2022.01.010.
- Retallack, G.J., 2022c, Soil salt and microbiome diversification over the past 3700 million years:
Palaeogeography, Palaeoclimatology, Palaeoecology, v. 598, 111016,
https://doi.org/10.1016/j.palaeo.2022.111016.
- Retallack, G.J., Krinsley, D.H., Fischer, R., Razink, J.J., and Langworthy, K.A., 2016, Archean
coastal-plain paleosols and life on land: Gondwana Research, v. 40, p. 1–20,
https://doi.org/10.1016/j.gr.2016.08.003.
- Retallack, G.J., Chen, Z.Q., Huang, Y., and Fang, Y., 2021, Oxidizing atmosphere and life on land
during the late Paleoproterozoic outset of the “boring billion”: Precambrian Research, v. 364,
106361, https://doi.org/10.1016/j.precamres.2021.106361.
- Ribas, I., 2009, The Sun and stars as the primary energy input in planetary atmospheres: Proceedings
of the International Astronomical Union, v. 5, p. 3−18, https://doi.org/10.1017/S1743921309992298.
- Rye, R., and Holland, H.D., 1998, Paleosols and the evolution of atmospheric oxygen: A critical
review: American Journal of Science, v. 298, p. 621–672, https://doi.org/10.2475/ajs.298.8.621.
- Schwartzmann, D.W., 2017, Life’s critical role in the long-term carbon cycle: The biotic enhancement
of weathering: AIMS Geosciences, v. 3, p. 216–238, https://doi.org/10.3934/geosci.2017.2.216.
- Sheldon, N.D., 2006, Precambrian paleosols and atmospheric CO2 levels: Precambrian
Research, v. 147, p. 148–155, https://doi.org/10.1016/j.precamres.2006.02.004.
- Sheldon, N.D., and Retallack, G.J., 2001, Equation for compaction of paleosols due to burial:
Geology, v. 29, p. 247–250, https://doi.org/10.1130/0091-7613(2001)029<0247:EFCOPD>2.0.CO;2.
- Sheldon, N.D., Retallack, G.J., and Tanaka, S., 2002, Geochemical climofunctions from North American
soils and application to paleosols across the Eocene-Oligocene boundary in Oregon: The Journal of
Geology, v. 110, p. 687–696, https://doi.org/10.1086/342865.
- Som, S.M., Buick, R., Hagadorn, J.W., Blake, T.S., Perreault, J.M., Harnmeijer, J.P., and Catling,
D.C., 2016, Earth’s air pressure 2.7 billion years ago constrained to less than half of modern
levels: Nature Geoscience, v. 9, p. 448–451, https://doi.org/10.1038/ngeO2713.
- Walker, J.C., 1982, Climatic factors on the Archean Earth: Palaeogeography, Palaeoclimatology,
Palaeoecology, v. 40, p. 1–11, https://doi.org/10.1016/0031-0182(82)90082-7.
- Wordsworth, R., and Pierrehumbert, R., 2013, Hydrogen-nitrogen greenhouse warming in Earth’s early
atmosphere: Science, v. 339, p. 64–67, https://doi.org/10.1126/science.1225759.