Introduction
High-resolution 3D digital models are becoming increasingly common data sets in academic and commercial
applications. In the geosciences specifically, digital outcrop models (DOMs), or virtual outcrops, can
provide geoscientists with photorealistic models that preserve spatial precision, dimensionality, and
geometric relationships between geologic features that are inherently 3D and susceptible to distortion
and/or loss of information when rendered in 2D (Bellian et al., 2005; McCaffrey et al., 2005; Jones et
al., 2009). Digital 3D mapping approaches using DOMs have enabled geoscientists to perform supplemental
measurements, correlations, and interpretations that are difficult or impossible to obtain with
traditional methods (Figs. 1–2; Pavlis and Mason, 2017; Nesbit et al., 2018).
 Figure
1
Figure
1
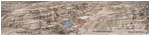
Geologic interpretations (line drawing on 2D field photograph), a common conventional method to
highlight stratigraphic architecture and distribution of related units. Mudstones are gray to light
brown; sandstones are light gray to white. This process is often performed on photos or a photomosaic
acquired in the field.
 Figure
2
Figure
2
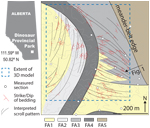
Traditional geologic map used to share field measurements, observations, and interpretations in 2D
plan-view. This geologic map was constructed from the integration of traditional fieldwork methods
(measured sections as well as paleoflow and bedding measurements) with digital outcrop model mapping to
characterize heterolithic channel-belt deposits exposed at Dinosaur Provincial Park, southeastern
Alberta, Canada. Field-based Facies Associations (FA)1—sandy point bar; FA2—heterolithic point bar;
FA3—Counterpoint bar; FA4—abandoned channel; FA5—mudstone. Bedding surfaces, noted in Figure 1 (red),
were digitally mapped on the 3D model and yield a more refined and detailed interpretation of accretion
surface orientation and stratigraphic architecture. These methods are being widely applied, yet the
results are difficult to disseminate and share in 3D.
Until recently, however, collection and use of digital data sets has been limited to specialists, due to
hardware and software limitations. A number of methods are now available for collecting and processing
3D models (Hodgetts, 2013; Carrivick et al., 2016). In particular, structure-from-motion and multi-view
stereo (SfM-MVS) photogrammetry software, commonly paired with uninhabited aerial vehicles (UAVs),
enables geoscientists to produce photorealistic DOMs through a highly streamlined UAV-SfM workflow
(Chesley et al., 2017; Nieminski and Graham, 2017; Pavlis and Mason, 2017; Nesbit and Hugenholtz, 2019).
Related efforts have centered on the development of 3D software solutions with tools for geoscience
applications. Custom software packages, such as Virtual Reality Geology Studio (VRGS; Hodgetts et al.,
2007) and LIME (Buckley et al., 2019), offer users lightweight executable tools and opportunities to
analyze and revisit data at multiple scales. Open source programs, such as Blender and CloudCompare, can
be used for data exploration and measurement and have also integrated specific geoscience toolsets
(e.g., Brodu and Lague, 2012; Dewez et al., 2016; Thiele et al., 2017).
Although acquiring DOMs has become more straightforward, and various 3D analysis programs are available,
dissemination of DOMs, interpretations, and results has remained a challenge due to software and
file-size barriers. Specialty 3D programs are often hindered by product licensing and can involve a
considerable learning curve to understand controls, file formats, and integrated tools. Furthermore,
DOMs can easily exceed multiple gigabytes (GB) in size, which can be taxing on computational resources
for rendering, file storage, and data transfer. With the growing collection of high-resolution DOMs and
similar 3D data sets, there is a need for dedicated, intuitive, and accessible 3D visualization
platforms.
Given the challenges outlined above, we examined existing visualization solutions that could potentially
enable sharing of DOMs and support open science through increased data accessibility. To provide a
functional introduction to modern visualization platforms, we illustrate the capabilities and
functionality of two web-based interfaces (Sketchfab and potree) and a cross-platform videogame engine
(Unity) using a geologic case study. A DOM was produced through a UAV-SfM workflow for an extensive
outcrop (1 km2) exposed within the badland landscape of Dinosaur Provincial Park (Alberta,
Canada). Each visualization platform provides access to the large DOM through an intuitive lightweight
interface without the need for high-end hardware, specialized software, or transfer and storage of large
files. This prompts an increased ability to share data sets, interpretations, and results with a wider
community, expanding opportunities for scientific communication and open science education.
Related Work
Visualization of digital 3D models has been practical for more than two decades; however, early
geoscience applications were typically restricted to dedicated geovisualization labs and required
specialized software (e.g., Thurmond et al., 2006; Jones et al., 2009; Bilke et al., 2014). Today,
visualization of large 3D data sets is no longer limited to sophisticated labs, but rather an average
computer can render 3D models efficiently, due in large part to inexpensive hardware, such as dedicated
graphics processing units (GPUs). Despite the capabilities of modern computing hardware, bottlenecks
remain, with a lack of accessible visualization software and the need to transfer large files.
Though separate 3D viewers are available to supplement proprietary software (e.g., Trimble RealWorks,
FugroViewer), they typically require local storage of large files, learning curves, and have associated
licensing restrictions. Alternative applications, such as digital globes (e.g., Google Earth) are a
popular method for disseminating spatial and non-spatial data in an interactive, semi-immersive
environment, with intuitive controls (Goodchild et al., 2012). Digital globes have been used to create
“virtual field trips” (McCaffrey et al., 2010; Simpson and De Paor, 2010; De Paor and Whitmeyer, 2011)
and present 3D data sets (Blenkinsop, 2012; De Paor, 2016). Although digital globes provide tremendous
benefits, displaying DOMs within digital globes requires a significant reduction of detail and results
in overlay issues relative to underlying base layers (Tavani et al., 2014).
Web-based dissemination may be one of the most promising and practical means for rapidly streaming 3D
digital data sets without transferring raw data (Turner, 2006; von Reumont et al., 2013). Advances of
application programming interfaces (APIs), such as WebGL, allow modern Internet browsers to access the
local GPU to improve rendering of 2D and 3D graphics, without the need for plug-ins or extensions
(Boutsi et al., 2019). Though not guaranteed, WebGL enables GPU functionality on various operating
systems and devices (Schuetz, 2016). Several proprietary web viewers, such as Sketchfab (https://www.sketchfab.com), use WebGL for sharing 3D models.
Proprietary web-based viewers have recently been used by geologic databases (e.g., Safari Database, https://www.safaridb.com: Howell et al., 2014; eRock: Cawood et al.,
2019).
Web viewers based on open source code, such as potree (Schuetz, 2016), use WebGL API to efficiently
render massive point clouds (>109 points) in standard Internet browsers. Potree does not
require end-users to install software or download large data sets (Schuetz, 2016) and has been adopted
by various organizations, including the USGS, for sharing and visualizing national topographic LiDAR
data sets (USGS, 2019). Similarly, OpenTopography and Pix4Dcloud provide online viewers, similar to
potree, allowing subscribers to share point clouds through standard web browsers.
Alternative methods have incorporated the use of game engines to create customized geovisualizations
compatible with various operating systems. Unity and Unreal Engine are two popular game development
platforms that are well-documented, have vast online programming communities, and are available for free
to developers producing revenue below a defined threshold. Recently, game engines have been used in the
geosciences for the gamification and sharing of 3D data sets in immersive virtual reality (VR) (Bilke et
al., 2014), translating ArcGIS data into a 3D environment using Unity (Robinson et al., 2015), and
presenting virtual archaeological sites (Martinez-Rubi et al., 2016; Boutsi et al., 2019).
Case Study: Fluvial Stratigraphy, Dinosaur Provincial Park
Geological Overview
Dinosaur Provincial Park is a UNESCO World Heritage Site in southeastern Alberta, Canada, recognized for
an abundance of well-preserved dinosaur fossils and characteristic badland topography (Dodson, 1971;
Currie and Koppelhus, 2005). This case study presents a 1 km2 subsection within the
northeastern portion of the park containing extensive 3D exposures of the Late Cretaceous Dinosaur Park
Formation (Wood et al., 1988; Eberth and Hamblin, 1993). Contrasting layers of siltstone and fine- to
medium-grained sandstone along with the stratigraphic architecture are representative of successive
meandering channel belts cutting through adjacent floodplain mudstones (Figs. 1–2; Smith et al., 2009;
Nesbit et al., 2018; Durkin et al., 2020). Most of the park is a natural preserve accessible only
through research permits or guided programs. The digital model provides a viewing window into a small
section of the park without disrupting wildlife and the natural landscape.
Data Collection and DOM Processing
Images were collected through eight flights with a sensefly eBee fixed-wing UAV equipped with a Sony
WX220 18.2 megapixel camera, resulting in 1760 images. Images were recorded at a pitch angle of 10º
off-nadir to increase point visibility along sub-vertical surfaces and increase precision of final
models within the high-relief topography (Nesbit and Hugenholtz, 2019). Images were processed using
Pix4Dmapper v4.3 following a similar workflow described by previous authors (Küng et al., 2012; Nesbit
et al., 2018). Following initial processing, the model was divided into four quadrants and processed
into a dense point cloud and 3D textured mesh. Mesh outputs were exported as Autodesk Filmbox (.fbx)
format, which generally results in smaller file sizes than commonly used 3D polygon (.ply) and wavefront
(.obj) formats.
Visualization Approaches
DOMs are presented in textured mesh and dense point cloud formats, using three different visualization
platforms (Sketchfab, potree, and Unity). Although other platforms are available, these were
intentionally selected for their ability to provide end-users with access to 3D data sets without
specialty software or transfer of large data sets and are representative of the current capabilities of
modern viewers.
Web-Based 3D Mesh (Sketchfab)
Using a web-based interface, Sketchfab allows authors to intuitively upload models, define rendering
options (e.g., lighting, material properties), and provide supplementary annotations (Fig. 3A). Upload
limitations of 200 MB, including all mesh and texture components, prevented rendering of the complete 1
km2 field area within a single viewer without significant texture distortion. To preserve
detail within the field area, we present each quadrant separately. Multiple texture resolutions and VR
compatibility are automatically generated during upload to provide end-users with different level of
detail (LoD) rendering options based on the capabilities of their viewing device. Location-specific
annotations describing geologic features and concepts to end-users were added to models using the upload
interface. Additional data sets could not be integrated within 3D model space.
Web-Based 3D Point Cloud (potree)
Viewers using potree code can render raw point clouds and integrate multiple data sets into a single
viewer with customizable options. The dense point cloud for the 1 km2 field area is ~25.5 GB
and contains more than 805 million points (Fig. 3B). Point cloud data sets can be compressed (from .las
to .laz format) to reduce file size and converted into a potree file and folder structure for efficient
tile-based rendering using the potree converter (Schuetz, 2016), with a final size of 3.5 GB. By
default, the potree code includes an interactive overview map that displays the viewer’s location and
view direction, various navigation options and settings, and several measurement tools allowing
end-users to record simple measurements, including distances, areas, volumes, and topographic cross
sections. Following conversion, the files and folder structure can be added to a web host and dispersed
through a standard web domain. Information on getting started can be found on the potree GitHub page or
homepage (http://www.potree.org). An example is presented in Figure 3B using the
Pix4Dcloud viewer, which implements the potree library.
 Figure
3
Figure
3
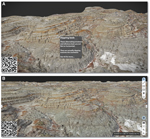
Digital outcrop models (DOMs) of the heterolithic channel-belt deposits in Figure 1, presented in two
different viewers. (A) Sketchfab viewer contains 3D textured mesh DOM, but is limited by resolution and
only supports text annotations to provide supplemental information; note the limited field area loaded
to preserve detail in texture and topography—additional interactive models of the field area are online
at
https://sketchfab.com/paulnesbit or by following the QR code.
Additional proprietary web viewers include Euclidean Vault (
https://www.euclideon.com/vaultinfo/), and voxxlr (
https://www.voxxlr.com).
(B) Visualization of the 3D dense point cloud DOM of the entire 1 km
2 field area (>805
million points) in a standard web browser using potree code applied in customized web viewer from Pix4D.
QR code provides digital access to the fully interactive viewer, also available at
http://tiny.cc/Pix4DpotreeViewer.
Videogame Engine (Unity)
Videogame engines allow the production of unique end-user experiences through customized data
visualization and presentation (Fig. 4). Unity provides a platform to design and develop videogames and
is well documented through user manuals, community forums, and online tutorials (e.g., https://unity.com/learn/get-started). The program interface contains
simple “drag and drop” functions for creation of simple scenes, but also allows fully customizable
objects and interaction through scripting. Unity supports various formats, including point clouds,
meshes, and 2.5D digital elevation models (DEMs). However, point cloud rendering through Unity can be
challenging (Fraiss, 2017), and DEM interpolations are susceptible to distortion along slopes (Bellian
et al., 2005; Pavlis and Mason, 2017). Therefore, we used 3D meshes (.fbx files) and associated textures
(.jpg), which made up much of the final videogame file size (~1 GB).
 Figure
4
Figure
4
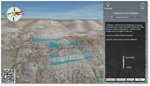
Videogame viewer (executable application) of the entire 1 km
2 field area rendered as a
textured mesh and created with Unity. Note the dynamic orientation arrow in the upper left corner of the
game, the options menu to the right of the screen, and interpretations of geologic surfaces turned “on.”
Dropdown menu in the side panel provides end-users with options to navigate to predefined “points of
interest” throughout the field area, simulating virtual field-trip stops. Note the resolution difference
between the foreground (uninhabited aerial vehicle [UAV]) model and the peripheral topography and
landscape, created with a digital elevation model draped with a 10 m satellite image. End-users can also
select “free fly” mode in order to navigate throughout the field site on their own. A fully interactive
viewer is available in GSA’s Data Repository
1 (also accessible from the QR code). Both data
repository supplemental files are interactive videogame visualizations presenting a “virtual field trip”
that introduces basic geology concepts using a UAV– Structure from Motion textured mesh model within
Dinosaur Provincial Park (Alberta, Canada). One is a standalone application (.exe file) for machines
running Windows (no software required). The other is a standalone application (.app file) for machines
running macOS (no software required). Note the README.txt file after unzipping prior to running.
Navigation within the scene was programmed through a first-person movement script, in which the camera is
controlled by directional keys on the keyboard and orientation based on the mouse. Camera movement was
restricted within the scene boundaries by enabling the “mesh collider” option within the mesh options
panel. Various components were added to the scene, such as the sky background, surrounding topography,
and interactive features. Sky textures were adapted from the Unity Asset Store (assetstore.unity.com).
Surrounding topography was added by creating a terrain object within Unity, defining height values by
importing a 10 m DEM (AltaLIS, 2017), textured with a 10-m true-color satellite image (Copernicus,
2018). Interactive features were added to a dropdown menu within the user interface (UI) and included
several “points of interest” that automatically transport end-users to areas with educational
information within the scene. The UI menu allows users to navigate between integrated data sets and
associated information panels within the scene and can be exited at any time to return to free fly mode.
Discussion
Sharing of large 3D data sets without specialist software is possible through modern viewers; however, a
host of challenges remain with current solutions before the full potential can be realized. Data
acquisition technologies continue to offer higher resolutions and larger file sizes. Contrastingly,
visualization platforms commonly limit file sizes, forcing a compromise between field area extent and
detail. As demand increases for sharing larger 3D data sets, more advanced multi-resolution rendering
solutions, such as LoD in Sketchfab and LIME or tiled approaches similar to potree, will be essential.
Options for end-users to select display quality based on the capabilities of their machine provides
additional avenues to smoothly render large data sets; for example, the Unity UI offers Quality
and Screen Resolution settings upon startup, and potree code provides adjustable options for
Point Budget and Quality.
Capabilities of 3D viewers can be expanded through incorporation of basic interpretation tools, the
ability to integrate multiple data sets, and customizable interfaces. There are various levels of
customizability in modern platforms. Sketchfab, for example, currently permits addition of text and
web-linked photo annotations, but does not support integration of additional 3D objects, shapefiles, or
drawings. Open source platforms (e.g., potree and Unity) contain support to integrate meshes,
shapefiles, and custom objects within a scene (Fig. 4) but require additional coding to convert and
render data properly. The default potree code supports basic measurement tools (see Fig. 3B), but
further customization within potree or Unity requires significant upfront programming efforts.
Compatibility and design considerations may also emerge as issues for visualization platforms. Although
potree code is currently compatible with standard web browsers, future updates to browsers may impede
performance. Similarly, users who rely on third-party applications are subject to decisions made by
suppliers. On the other hand, formats supported by Unity (e.g., Windows [.exe], Apple [.app], mobile
device [iOS, Android], Sony PlayStation 4, Microsoft Xbox, and WebGL) have been standard for their
respective platforms and are likely to maintain functionality through updates, as backward compatibility
is often built into new versions.
Cartographic principles will become increasingly important as 3D visualizations are used to disseminate
spatial data layers with 3D DOMs. This technique has the potential to extend models beyond simple
visuals into scientific visualizations designed to aid the understanding of data, provide new
perspectives, and provoke individual knowledge construction (MacEachren and Kraak, 1997). Delivering
data in this way requires consideration of cartographic design as it relates to the purpose of a model,
intended audience, and how to best present data. For example, use of these platforms as geospatial data
viewers still requires basic map components (e.g., scale, orientation, legend, metadata, etc.), which
are not currently available in some 3D viewers, but are essential for extending these 3D models to
spatially meaningful 3D geovisualizations.
Conclusions and Recommended Use
Tools for collecting high-resolution 3D data sets have recently become commonplace in both commercial and
academic fields; however, sharing 3D data sets typically requires end-users to have specialty software,
high-end processing computers, and/or locally store large files. Through the presentation of a large
UAV-SfM derived DOM, we introduce three representative visualization platforms that harness potential to
advance 3D data dissemination and promote open science communication to end-users without the need for
specialized software and hardware.
Web-based viewers, such as Sketchfab and potree, provide practical options for sharing data sets with
end-users without cumbersome transfer and storage of large files. Web-based viewers typically provide an
easy solution to share 3D visualizations without the need for programming, though customizability and
file sizes are limited. The default potree code has extended capabilities, such as measurement tools,
display options, and the ability to integrate multiple file types within a single viewer. Open-source
code allows capable programmers to customize the potree viewer and could potentially be used as a raw
data viewer or educational supplement. A web domain and web storage are required to host potree
visualizations, which may limit uptake for educational purposes, but it remains promising for sharing
raw data sets with collaborators or commercial partners.
Game engines require more significant coding knowledge for customized visualizations and measurement
tools and may therefore be less practical as raw data viewers. However, videogames create opportunities
to broaden scientific communication and education beyond conventional 2D maps and photo-based line
drawings (e.g., Figs. 1–2) by contextualizing 3D information within a 3D, immersive, and realistic
environment (Fig. 4). Videogame visualization could be used for engaging museum displays, presentation
of course material, or virtual field experiences, in which “participants” can follow guided prompts or
explore the scene freely in self-navigation mode.
Although virtual platforms provide exciting potential for enhanced student learning and improved
scientific communication to the broader public, their efficacy as a learning tool necessitates future
research. Regardless, emerging visualization platforms provide access to 3D data sets without the need
for advanced software and hardware. Though often limited by logistical constraints, we encourage authors
to share high-resolution DOM data sets whenever possible. Methods of 3D data dissemination and
visualization are still in their infancy behind the relatively recent rise in 3D mapping applications
and acquisition techniques; as the latter continue to grow, we expect the former to develop in new and
unique ways to facilitate open science initiatives through communication and democratization of
photorealistic 3D models.
Acknowledgments
We thank the GSA Today editorial team and two anonymous reviewers for recommendations that
greatly improved this manuscript, and thanks for research permission from Dinosaur Provincial Park
(Research Permit #17-146) and land access from J.G. and L.X.
References Cited
- AltaLIS, 2017, Alberta 20K Digital Elevation Model (DEM).
- Bellian, J.A., Kerans, C., and Jennette, D.C., 2005, Digital outcrop models: Applications of
terrestrial scanning lidar technology in stratigraphic modeling: Journal of Sedimentary Research, v.
75, p. 166–176, https://doi.org/10.2110/jsr.2005.013.
- Bilke, L., Fischer, T., Helbig, C., Krawczyk, C., Nagel, T., Naumov, D., Paulick, S., Rink, K.,
Sachse, A., Schelenz, S., Walther, M., Watanabe, N., Zehner, B., Ziesch, J., and Kolditz, O., 2014,
TESSIN VISLab—Laboratory for scientific visualization: Environmental Earth Sciences, v. 72, p.
3881–3899, https://doi.org/10.1007/s12665-014-3785-5.
- Blenkinsop, T.G., 2012, Visualizing structural geology: From Excel to Google Earth: Computers &
Geosciences, v. 45, p. 52–56, https://doi.org/10.1016/j.cageo.2012.03.007.
- Boutsi, A., Ioannidis, C., and Soile, S., 2019, Interactive online visualization of complex 3D
geometries: The International Archives of the Photogrammetry, Remote Sensing and Spatial Information
Sciences, v. XLII-2, W9, p. 173–180, https://doi.org/10.5194/isprs-archives-XLII-2-W9-173-2019.
- Brodu, N., and Lague, D., 2012, 3D terrestrial lidar data classification of complex natural scenes
using a multi-scale dimensionality criterion: Applications in geomorphology: ISPRS Journal of
Photogrammetry and Remote Sensing, v. 68, p. 121–134,
https://doi.org/10.1016/j.isprsjprs.2012.01.006.
- Buckley, S.J., Ringdal, K., Naumann, N., Dolva, B., Kurz, T.H., Howell, J.A., and Dewez, T.J.B.,
2019, LIME: Software for 3-D visualization, interpretation, and communication of virtual geoscience
models: Geosphere, v. 15, p. 1–14, https://doi.org/10.1130/GES02002.1.
- Carrivick, J.L., Smith, M.W., and Quincey, D.J., 2016, Structure from Motion in the Geosciences:
Oxford, UK, Wiley-Blackwell, https://doi.org/10.1002/9781118895818.
- Cawood, A.J., and Bond, C.E., 2019, eRock: An open-access repository of virtual outcrops for
geoscience education: GSA Today, v. 29, p. 36–37, https://doi.org/10.1130/GSATG373GW.1.
- Chesley, J., Leier, A., White, S., and Torres, R., 2017, Using unmanned aerial vehicles and
structure-from-motion photogrammetry to characterize sedimentary outcrops: An example from the
Morrison Formation, Utah, USA: Sedimentary Geology, v. 354, p. 1–8,
https://doi.org/10.1016/j.sedgeo.2017.03.013.
- CloudCompare, 2019, Version 2.9. GPL Software. Available online: http://www.cloudcompare.org
(accessed 7 Feb. 2020).
- Copernicus, 2018, Sentinal data: Retrieved from USGS, Earth Explorer 15 August 2019, processed by
ESA.
- Currie, P.J., and Koppelhus, E.B., editors, 2005, Dinosaur Provincial Park: A Spectacular Ancient
Ecosystem Revealed: Bloomington, Indiana, Indiana University Press, 648 p.
- De Paor, D.G., 2016, Virtual rocks: GSA Today, v. 26, p. 4–11, https://doi.org/10.1130/GSATG257A.1.
- De Paor, D.G., and Whitmeyer, S.J., 2011, Geological and geophysical modeling on virtual globes
using KML, COLLADA, and Javascript: Computers & Geosciences, v. 37, p. 100–110,
https://doi.org/10.1016/j.cageo.2010.05.003.
- Dewez, T.J.B., Girardeau-Montaut, D., Allanic, C., and Rohmer, J., 2016, Facets : A CloudCompare
plugin to extract geological planes from unstructured 3D point clouds: International Archives of the
Photogrammetry, Remote Sensing and Spatial Information Sciences—ISPRS Archives, v. 41, p. 799–804,
https://doi.org/10.5194/isprsarchives-XLI-B5-799-2016.
- Dodson, P., 1971, Sedimentology and taphonomy of the Oldman Formation (Campanian), Dinosaur
Provincial Park, Alberta (Canada): Palaeogeography, Palaeoclimatology, Palaeoecology, v. 10, p.
21–74, https://doi.org/10.1016/0031-0182(71)90044-7.
- Durkin, P.R., Hubbard, S.M., Holbrook, J.M., Weleschuk, Z., Nesbit, P.R., Hugenholtz, C.H., Lyons,
T., and Smith, D.G., 2020, Recognizing the product of concave-bank sedimentary processes in fluvial
meander-belt strata: Sedimentology (in press).
- Eberth, D.A., and Hamblin, A.P., 1993, Tectonic, stratigraphic, and sedimentologic significance of a
regional discontinuity in the upper Judith River Group (Belly River wedge) of southern Alberta,
Saskatchewan, and northern Montana: Canadian Journal of Earth Sciences, v. 30, p. 174–200,
https://doi.org/10.1139/e93-016.
- Fraiss, S.M., 2017, Rendering Large Point Clouds in Unity [B.S. thesis]: Vienna, University of
Technology (TU Wien), 38 p.
- Goodchild, M.F., Guo, H., Annoni, A., Bian, L., de Bie, K., Campbell, F., Craglia, M., Ehlers, M.,
van Genderen, J., Jackson, D., Lewis, A.J., Pesaresi, M., Remetey-Fülöpp, G., Simpson, R., Skidmore,
A., Wang, C., and Woodgate, P., 2012, Next-generation Digital Earth: Proceedings of the National
Academy of Sciences of the United States of America, v. 109, p. 11,088–11,094,
https://doi.org/10.1073/pnas.1202383109.
- Hodgetts, D., 2013, Laser scanning and digital outcrop geology in the petroleum industry: A review:
Marine and Petroleum Geology, v. 46, p. 335–354, https://doi.org/10.1016/j.marpetgeo.2013.02.014.
- Hodgetts, D.L., Gawthorpe, R., Wilson, P., and Rarity, F., 2007, Integrating Digital and Traditional
Field Techniques Using Virtual Reality Geological Studio (VRGS): 69th EAGE Conference and Exhibition
incorporating SPE EUROPEC 2007, p. 11–14, https://doi.org/10.3997/2214-4609.201401718.
- Howell, J.A., Martinius, A.W., and Good, T.R., 2014, The application of outcrop analogues in
geological modelling: A review, present status and future outlook, in Martinius, A.W., Howell, J.A.,
and Good, T.R., eds., Sediment-Body Geometry and Heterogeneity: Analogue Studies for Modelling the
Subsurface: Geological Society, London, Special Publication 387, p. 1–25,
https://doi.org/10.1144/SP387.12.
- Jones, R.R., McCaffrey, K.J., Clegg, P., Wilson, R.W., Holliman, N.S., Holdsworth, R.E., Imber, J.,
and Waggott, S., 2009, Integration of regional to outcrop digital data: 3D visualisation of
multi-scale geological models: Computers & Geosciences, v. 35, p. 4–18,
https://doi.org/10.1016/j.cageo.2007.09.007.
- Küng, O., Strecha, C., Fua, P., Gurdan, D., Achtelik, M., Doth, K.-M., and Stumpf, J., 2012,
Simplified building models extraction from ultra-light UAV imagery: ISPRS—International Archives of
the Photogrammetry, Remote Sensing and Spatial Information Sciences, v. XXXVIII-1, p. 217–222,
https://doi.org/10.5194/isprsarchives-XXXVIII-1-C22-217-2011.
- MacEachren, A.M., and Kraak, M.J., 1997, Guest editorial exploratory cartographic visualization:
Advancing the agenda: Computers & Geosciences, v. 23, p. 335–343,
https://doi.org/10.1016/S0098-3004(97)00018-6.
- Martinez-Rubi, O., de Kleijn, M., Verhoeven, S., Drost, N., Attema, J., van Meersbergen, M., van
Nieuwpoort, R., de Hond, R., Dias, E., and Svetachov, P., 2016, Using modular 3D digital earth
applications based on point clouds for the study of complex sites: International Journal of Digital
Earth, v. 9, p. 1135–1152, https://doi.org/10.1080/17538947.2016.1205673.
- McCaffrey, K.J.W., Jones, R.R., Holdsworth, R.E., Wilson, R.W., Clegg, P., Imber, J., Holliman,
N.S., and Trinks, I., 2005, Unlocking the spatial dimension: Digital technologies and the future of
geoscience fieldwork: Journal of the Geological Society, v. 162, p. 927–938,
https://doi.org/10.1144/0016-764905-017.
- McCaffrey, K.J.W., Hodgetts, D., Howell, J.A., Hunt, D., Imber, J., Jones, R.R., Tomasso, M.,
Thurmond, J., and Viseur, S., 2010, Virtual fieldtrips for petroleum geoscientists: Geological
Society, London, Petroleum Geology Conference Series, v. 7, p. 19–26,
https://doi.org/10.1144/0070019.
- Nesbit, P.R., and Hugenholtz, C.H., 2019, Enhancing UAV-SfM 3D model accuracy in high-relief
landscapes by incorporating oblique images: Remote Sensing, v. 11,
https://doi.org/10.3390/rs11030239.
- Nesbit, P.R., Durkin, P.R., Hugenholtz, C.H., Hubbard, S.M., and Kucharczyk, M., 2018, 3-D
stratigraphic mapping using a digital outcrop model derived from UAV images and
structure-from-motion photogrammetry: Geosphere, v. 14, p. 1–18, https://doi.org/10.1130/GES01688.1.
- Nieminski, N.M., and Graham, S.A., 2017, Modeling stratigraphic architecture using small unmanned
aerial vehicles and photogrammetry: Examples from the Miocene east coast basin, New Zealand: Journal
of Sedimentary Research, v. 87, p. 126–132, https://doi.org/10.2110/jsr.2017.5.
- Pavlis, T.L., and Mason, K.A., 2017, The new world of 3D geologic mapping: GSA Today, v. 27, p.
4–10, https://doi.org/10.1130/GSATG313A.1.
- Robinson, A., Gordon, C.E., Houghton, J., Lloyd, G.E., and Morgan, D.J., 2015, ArcGIS to Unity: A
design pipeline for creation of 3D terrain in serious egames for geology: Geology Today, v. 31, p.
237–240, https://doi.org/10.1111/gto.12121.
- Schuetz, M., 2016, Potree [Thesis]: Rendering Large Point Clouds in Web Browsers: Vienna University
of Technology, 84 p.
- Simpson, C., and De Paor, D.G., 2010, Restoring maps and memoirs to four-dimensional space using
virtual globe technology: A case study from the Scottish Highlands: Geological Society, London,
Special Publication 335, p. 429–441, https://doi.org/10.1144/SP335.20.
- Smith, D.G., Hubbard, S.M., Leckie, D.A., and Fustic, M., 2009, Counter point bar deposits:
Lithofacies and reservoir significance in the meandering modern Peace River and ancient McMurray
Formation, Alberta, Canada: Sedimentology, v. 56, p. 1655–1669,
https://doi.org/10.1111/j.1365-3091.2009.01050.x.
- Tavani, S., Granado, P., Corradetti, A., Girundo, M., Iannace, A., Arbués, P., Muñoz, J.A., and
Mazzoli, S., 2014, Building a virtual outcrop, extracting geological information from it, and
sharing the results in Google Earth via OpenPlot and Photoscan: An example from the Khaviz Anticline
(Iran): Computers & Geosciences, v. 63, p. 44–53, https://doi.org/10.1016/j.cageo.2013.10.013.
- Thiele, S.T., Grose, L., Samsu, A., Micklethwaite, S., Vollgger, S.A., and Cruden, A.R., 2017,
Rapid, semi-automatic fracture and contact mapping for point clouds, images and geophysical data:
Solid Earth, v. 8, p. 1241–1253, https://doi.org/10.5194/se-8-1241-2017.
- Thurmond, J.B., Løseth, T.M., Rivenæs, J.C., Martinsen, O.J., and Aiken, C.L.V., 2006, Using outcrop
data in the 21st century—New methods and applications, with example from the Ainsa Turbidite System:
Deep-Water Outcrops of the World Atlas, CD-ROM.
- Turner, A.K., 2006, Challenges and trends for geological modelling and visualisation: Bulletin of
Engineering Geology and the Environment, v. 65, p. 109–127,
https://doi.org/10.1007/s10064-005-0015-0.
- USGS, 2019, 3D Elevation Program (3DEP):
https://www.usgs.gov/news/usgs-3dep-lidar-point-cloud-now-available-amazon-public-dataset (accessed
11 Feb. 2020).
- von Reumont, F., Arsanjani, J.J., and Riedl, A., 2013, Visualization of geologic geospatial datasets
through X3D in the frame of WebGIS: International Journal of Digital Earth, v. 6, p. 483–503,
https://doi.org/10.1080/17538947.2011.627471.
- Wood, J.M., Thomas, R.G., and Visser, J., 1988, Fluvial processes and vertebrate taphonomy: The
upper cretaceous Judith River formation, South-Central Dinosaur Provincial Park, Alberta, Canada:
Palaeogeography, Palaeoclimatology, Palaeoecology, v. 66, p. 127–143,
https://doi.org/10.1016/0031-0182(88)90085-5.